The Chart section in the Backtester Results tab provides a visual representation of your backtested strategies directly on the price chart. This section integrates the results of your backtests with the corresponding market data, offering an in-depth view of how trades were executed and their outcomes.
Main Features
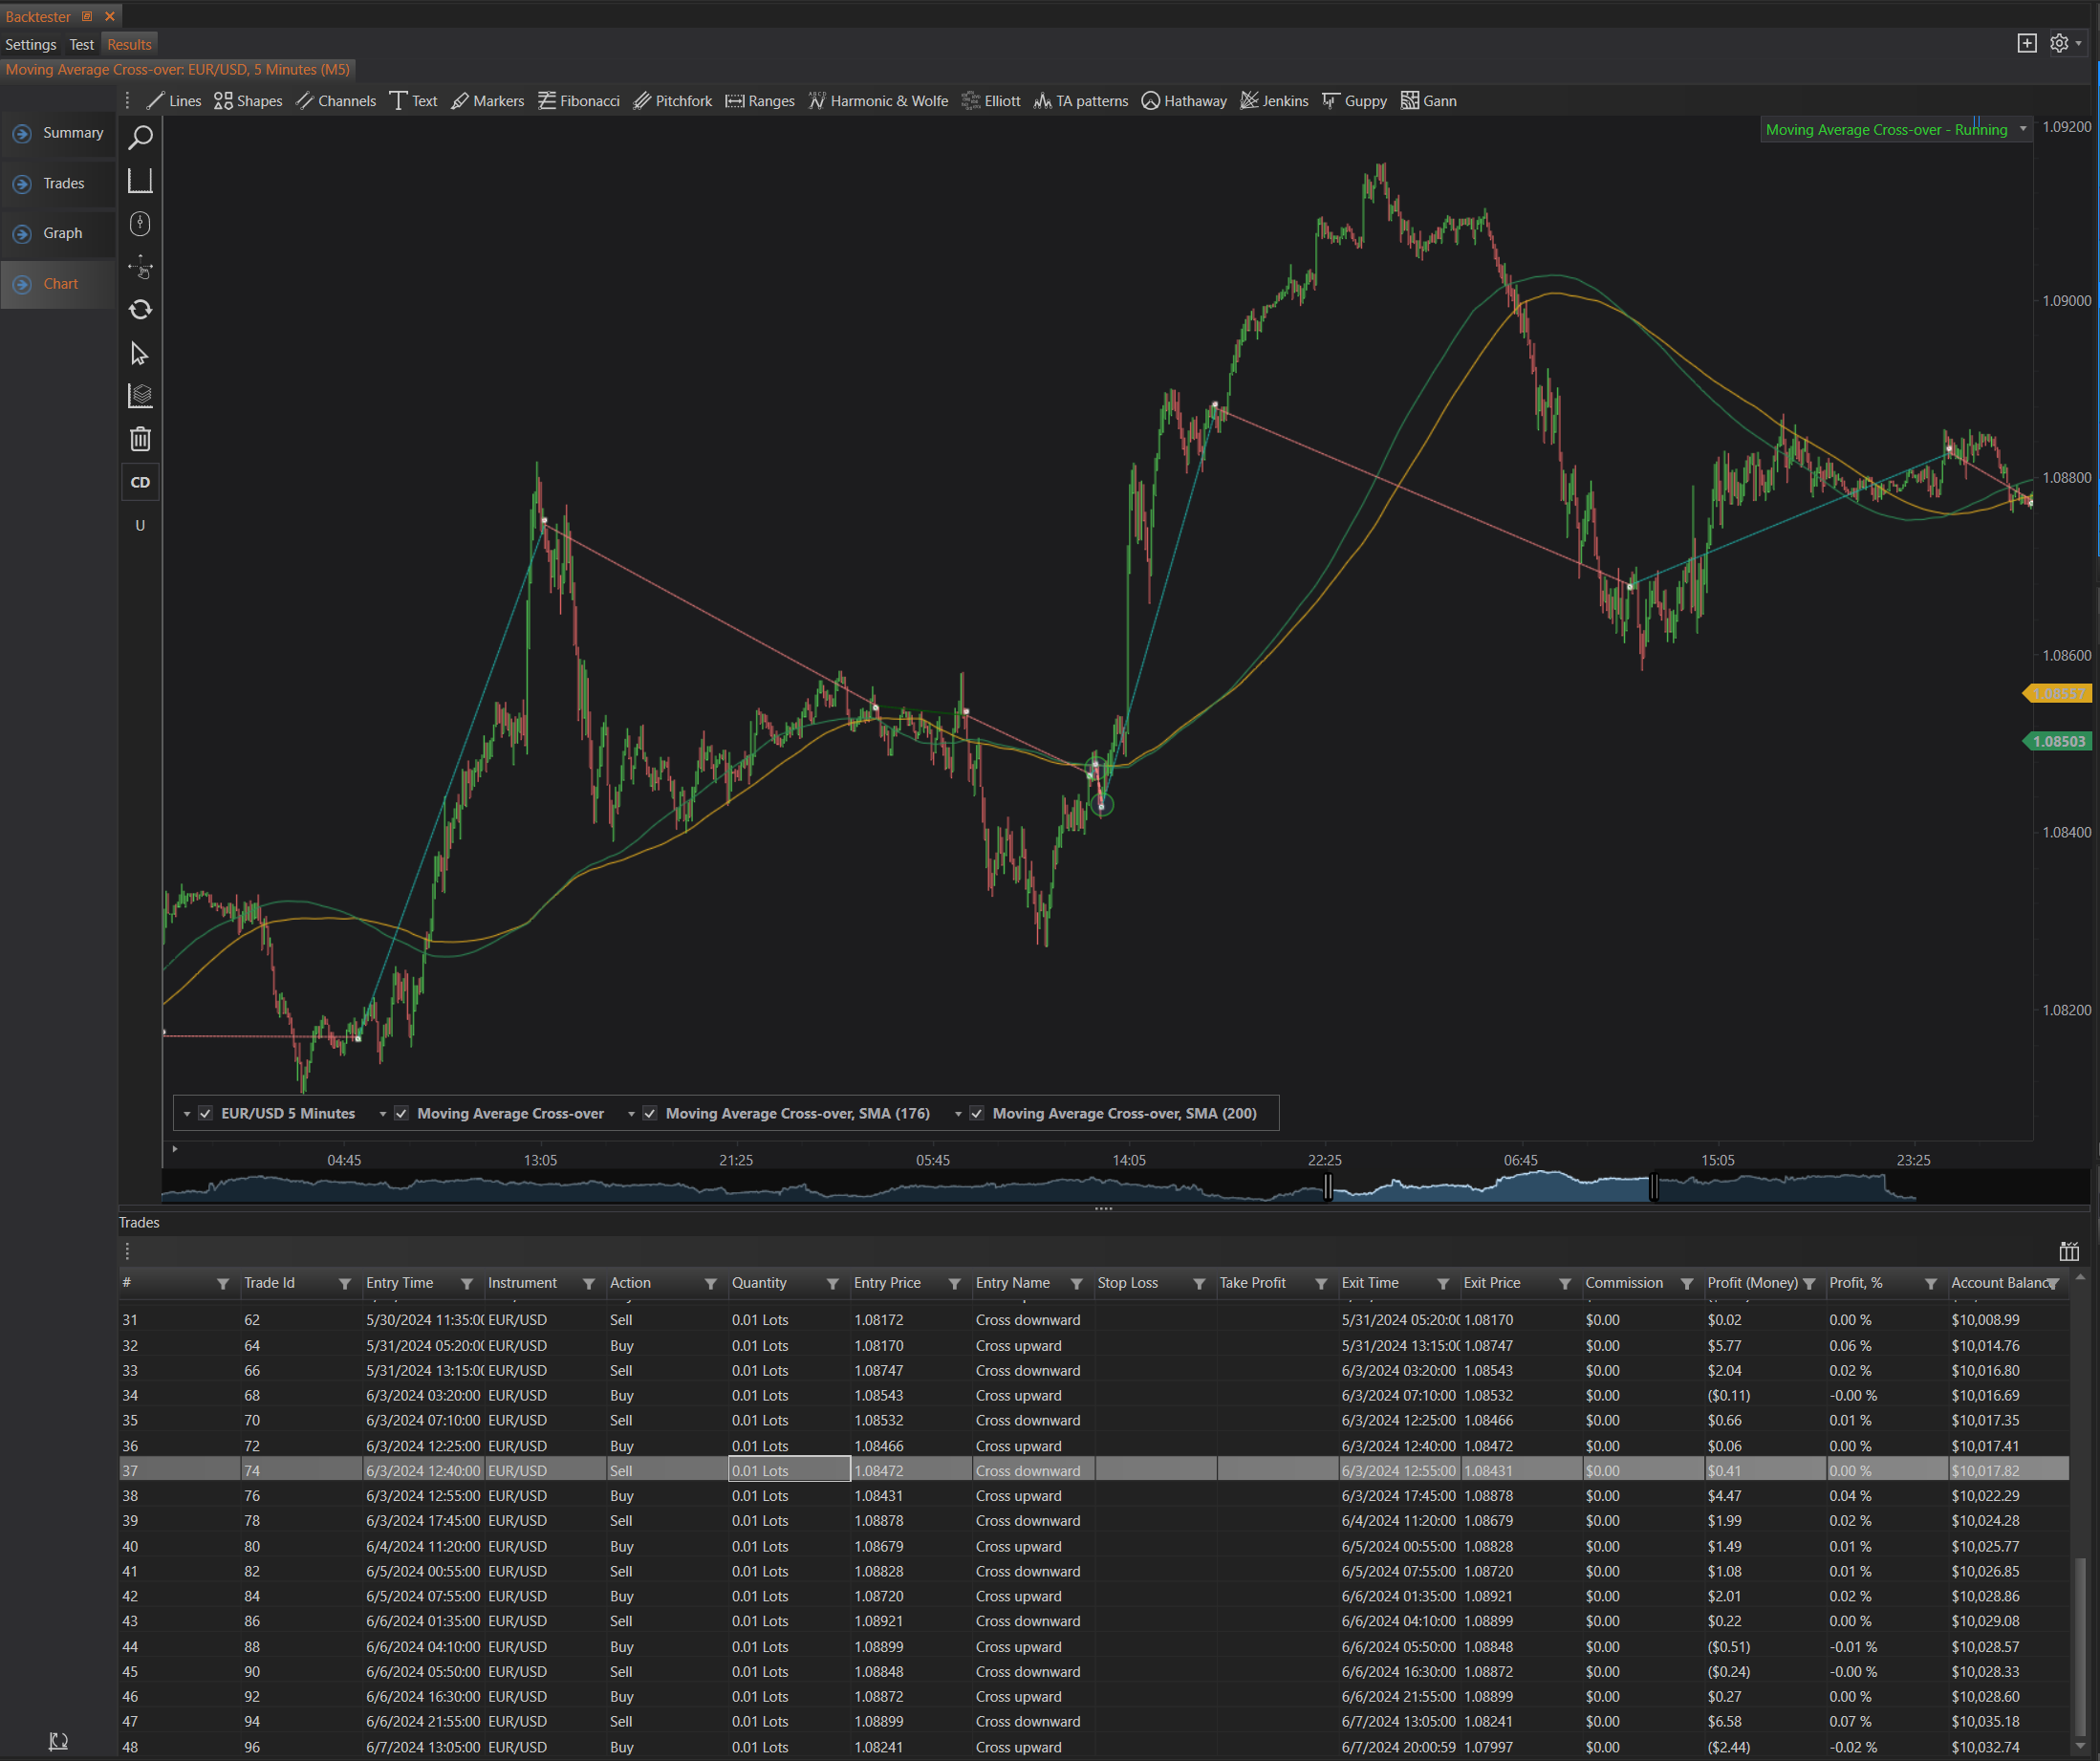
Strategy Visualization
- Indicator Plots: Display of various indicators used in the strategy. This can include moving averages, trend lines, and other technical analysis tools configured during the strategy setup.
- Trade Markers: Visual markers on the chart indicating the entry and exit points of each trade. These markers are color-coded to distinguish between buy and sell actions, providing a clear view of trade locations.
- Profit and Loss Display: Each trade marker can show the profit or loss in monetary terms or percentage, offering immediate feedback on the trade's outcome.
Interactive Trade Details
Hovering over trade markers on the chart provides detailed information about each trade. This includes:
- Entry and Exit Time: The exact time the trade was opened and closed.
- Trade Size: The volume of the trade.
- Profit or Loss: The financial result of the trade.
- Account Balance and Equity: The account status at the time of the trade.
Navigate to Detailed Information
- Navigate to Trade: Clicking on a trade marker allows users to navigate directly to the corresponding entry in the Trades section. This highlights the trade in the detailed trades table, making it easy to analyze specific trades.
- Navigate to Chart: In the detailed trade information window, clicking "Navigate to chart" will center the chart on the selected trade, providing a zoomed-in view of the market conditions during the trade.
Trades Table Integration
The Chart section includes an integrated trades table at the bottom of the screen. This table lists all trades executed during the backtest, providing a detailed summary of each trade including:
- Trade ID: Unique identifier for each trade.
- Entry and Exit Time: When the trade was opened and closed.
- Instrument: The financial instrument that was traded.
- Action: Whether the trade was a buy or sell.
- Quantity: The size of the trade.
- Entry and Exit Price: The prices at which the trade was executed.
- Stop Loss and Take Profit: The stop loss and take profit levels set for the trade.
- Profit (Money) and Profit (%): The profit or loss from the trade in both monetary terms and percentage.
- Account Balance: The account balance after the trade was closed.
Additional Chart Controls
- Period Selector: Allows users to select different timeframes (e.g., 5 minutes, 1 hour) to view the chart, facilitating multi-timeframe analysis.
- Indicator Management: Users can add or remove indicators from the chart to customize their analysis.
- Zoom and Pan: Interactive zooming and panning capabilities to closely inspect specific parts of the chart.
Summary
The Chart section in the Backtester Results tab is a powerful tool for visualizing and analyzing backtested strategies. It integrates detailed trade information directly on the price chart, enhancing the understanding of how strategies perform under various market conditions. By combining visual markers, interactive trade details, and an integrated trades table, it provides traders with a comprehensive view of their strategy's performance and helps in making informed adjustments for future optimizations.