The Summary section is designed to give users a quick and detailed snapshot of the overall performance of the tested strategy. This section includes several key components:
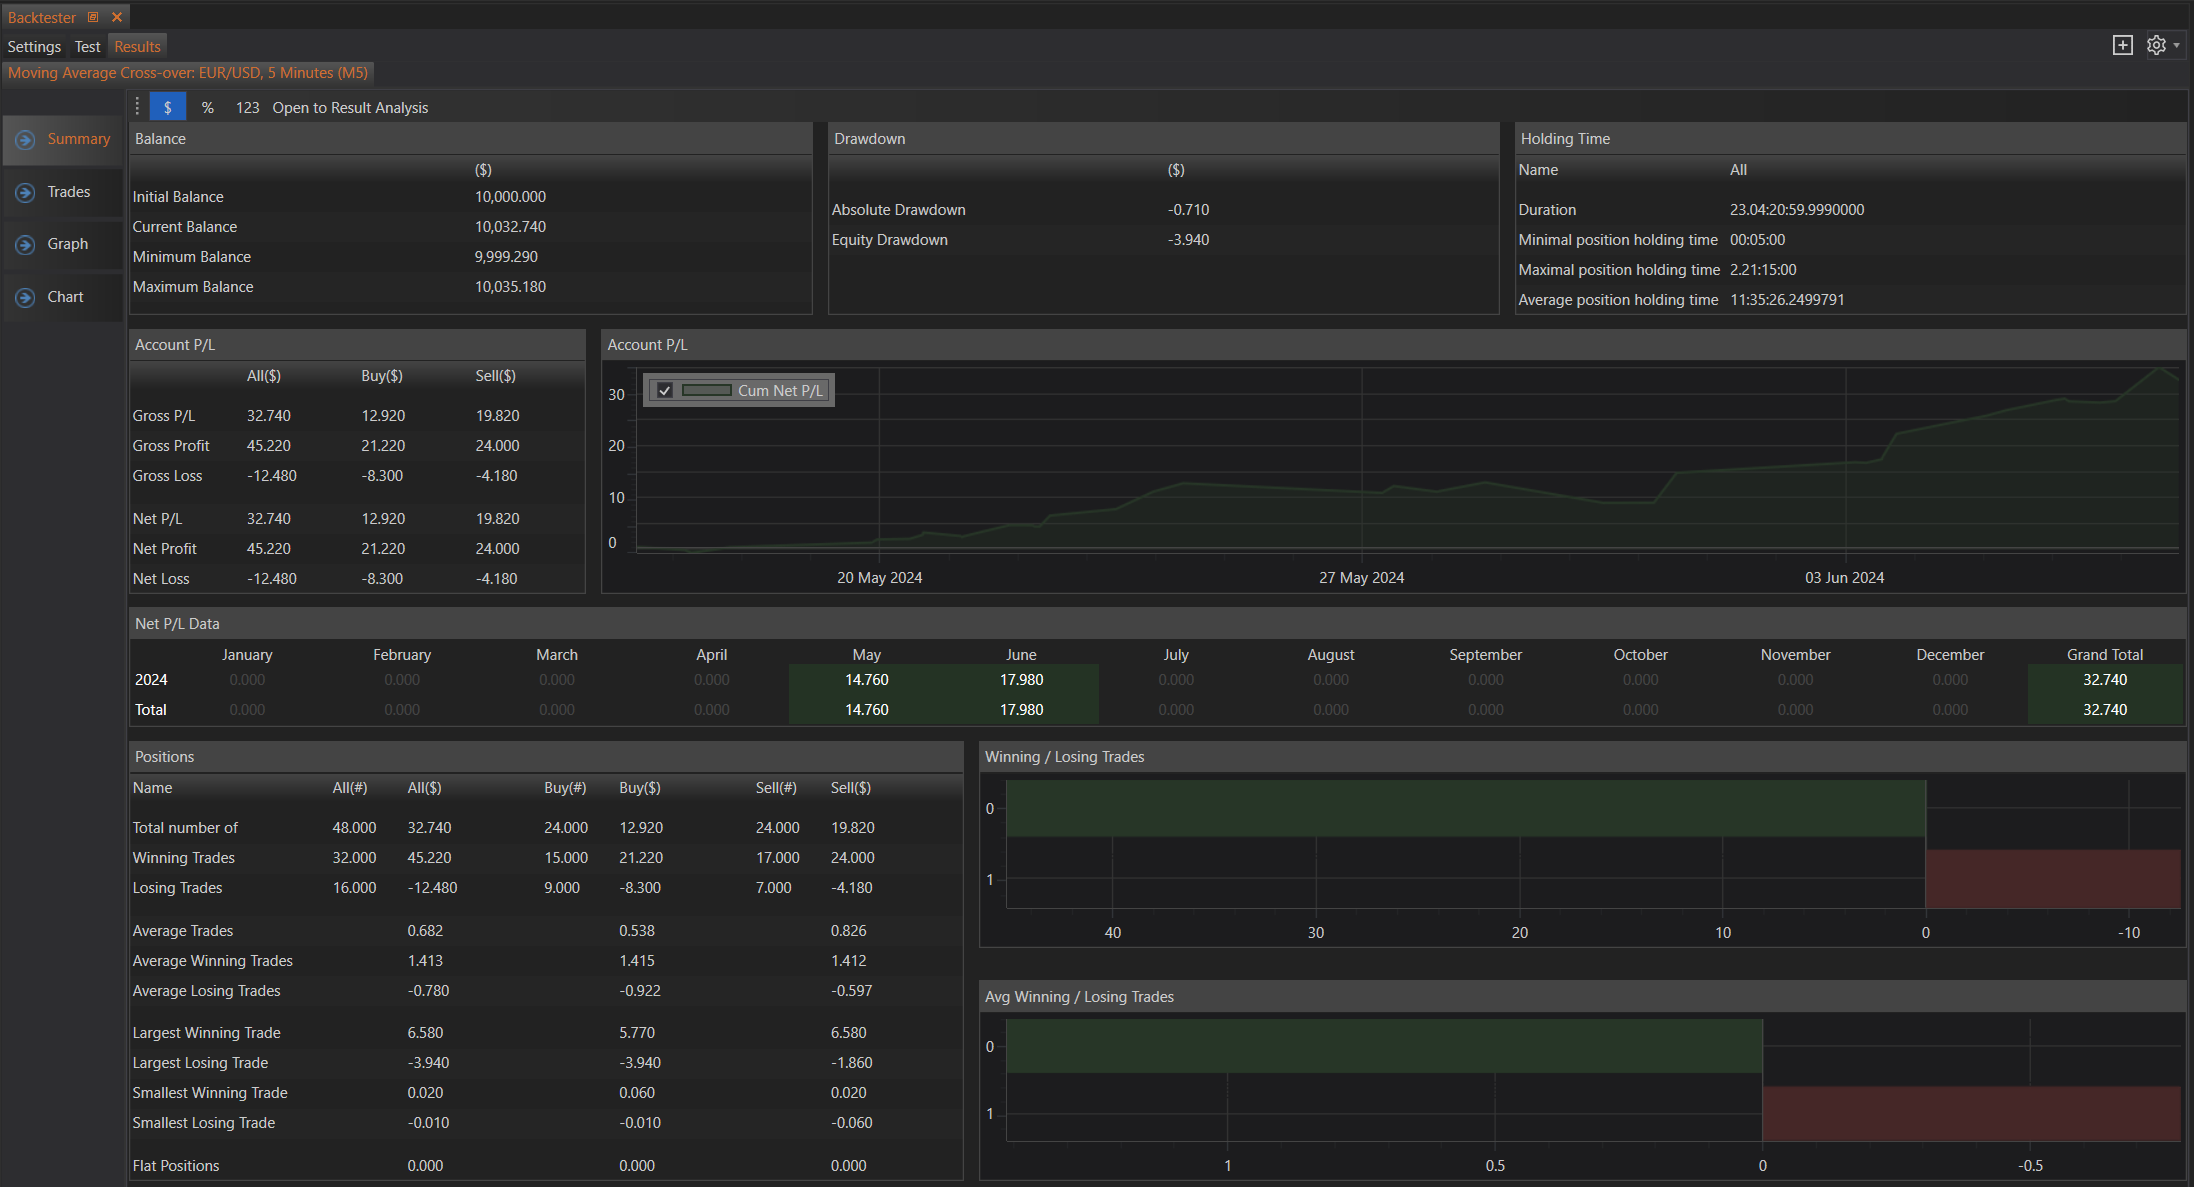
Balance
- Initial Balance: The starting balance of the account before the backtest began.
- Current Balance: The balance of the account at the end of the backtest.
- Minimum Balance: The lowest balance recorded during the backtest period.
- Maximum Balance: The highest balance recorded during the backtest period.
Drawdown
- Absolute Drawdown: The maximum loss from the initial balance during the backtest.
- Equity Drawdown: The maximum loss from the highest balance during the backtest.
Holding Time
- Duration: The total time the backtest ran.
- Minimal Position Holding Time: The shortest duration any position was held.
- Maximal Position Holding Time: The longest duration any position was held.
- Average Position Holding Time: The average duration positions were held.
Account P/L
- Gross P/L: Total profit or loss, broken down by buy and sell trades.
- Net P/L: Net profit or loss after accounting for trading costs.
- Net Profit: Total profit from all trades.
- Net Loss: Total loss from all trades.
- Account P/L Chart: A graphical representation of cumulative net P/L over time.
Net P/L Data
This table provides a monthly breakdown of net P/L data, showing the performance for each month and the total for the year.
Positions
- Total Number of Trades: The total number of trades executed.
- Winning Trades: Number and value of winning trades.
- Losing Trades: Number and value of losing trades.
- Average Trades: The average profit or loss per trade.
- Average Winning Trades: The average profit for winning trades.
- Average Losing Trades: The average loss for losing trades.
- Largest Winning Trade: The largest profit from a single trade.
- Largest Losing Trade: The largest loss from a single trade.
- Smallest Winning Trade: The smallest profit from a single trade.
- Smallest Losing Trade: The smallest loss from a single trade.
- Flat Positions: Positions that neither won nor lost.
Winning / Losing Trades
A visual representation showing the ratio of winning to losing trades.
Avg Winning / Losing Trades
A visual representation showing the average profit or loss for winning and losing trades.
This detailed summary allows users to quickly assess the performance of their trading strategy, identifying strengths and weaknesses, and making informed decisions for future optimizations.