The Visual tab in the Backtester settings specifies how the strategy's output is displayed on the chart. Each strategy involves entries and exits, and these need to be visually represented on the chart for analysis. The visual settings are derived from the strategy code, and different strategies will have varying parameters and settings based on their unique inputs.
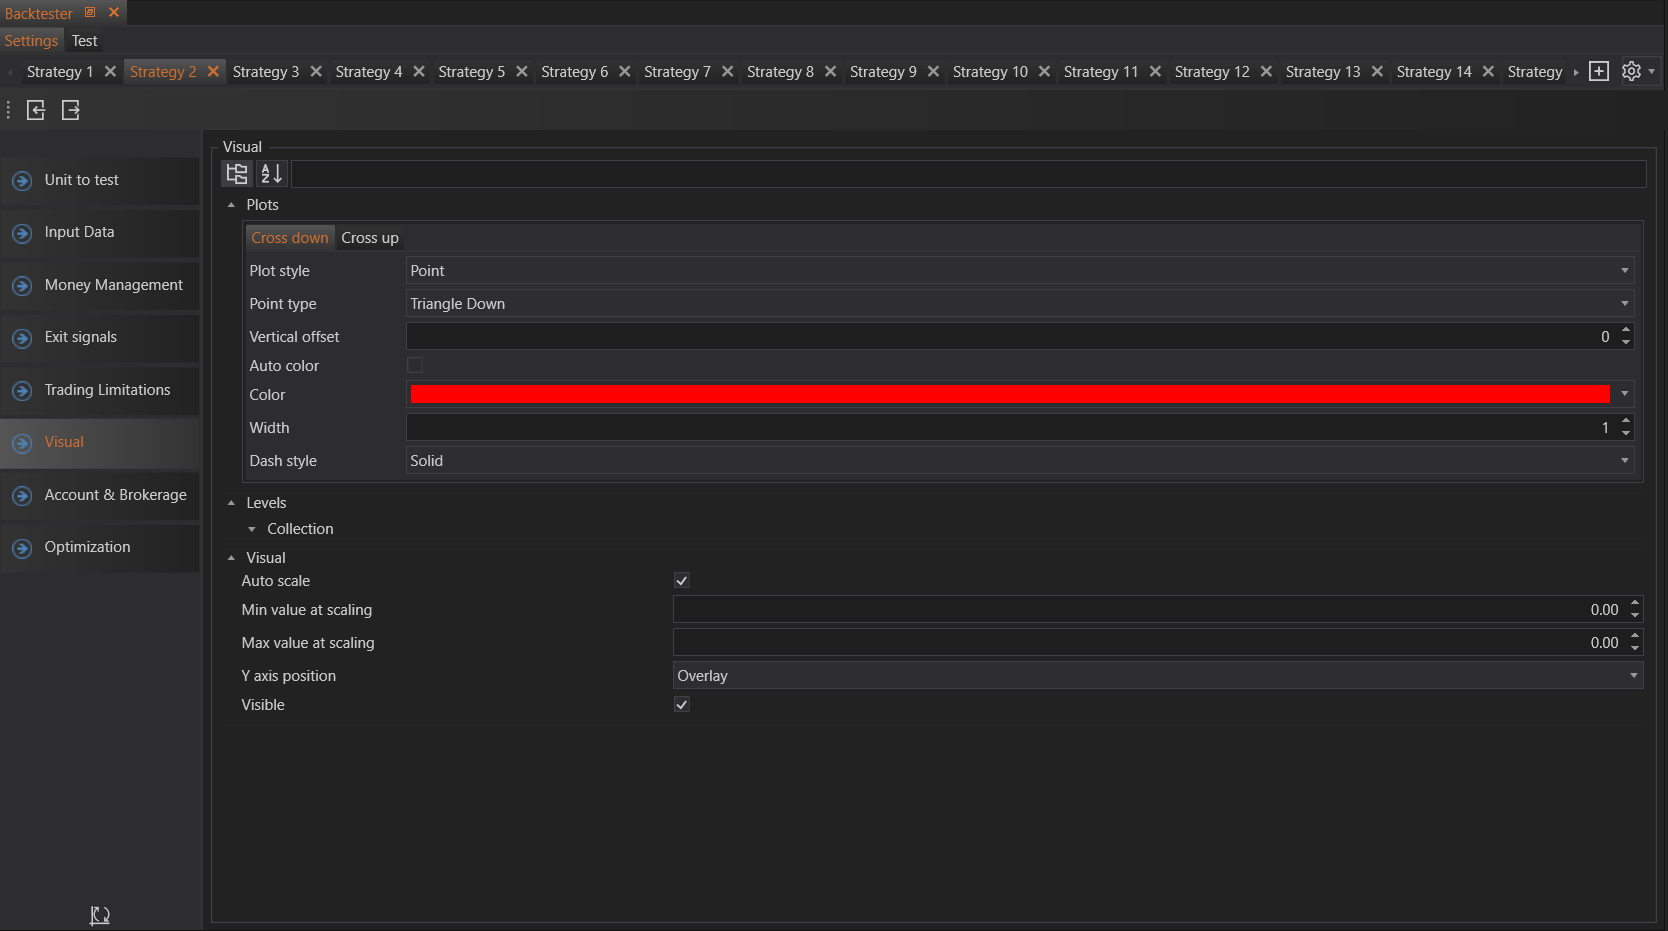
There are three main sections in the Visual tab:
Plots
The Plots section determines how trades are plotted on the chart. Various settings can be configured here:
-
Plot Style: Defines the style of the plot. Options include:
- Column
- Line
- Digital Line
- Mountain
- Point
- Vertical Line
-
Point Type: If "Point" is selected as the plot style, further customization is available with point types such as:
- Arrow Up
- Arrow Down
- Block
- Cross
- Dot
- Flag
- Hash
- Triangle Down
- Triangle Left
-
Vertical Offset: Sets how far away from the candle the symbol appears.
-
Auto Color: Automatically sets the color.
-
Color: Allows the user to choose the color manually.
-
Width: Specifies the overall size of the symbol.
-
Dash Style: Sets the style of the symbol line, such as solid, dashed, or dotted.
Levels
The Levels section is applicable for indicators that support levels. Here, users can adjust the visualization of indicator levels on the chart.
Visual
The Visual section controls the overall visual settings of the chart:
- Auto Scale: Enables automatic axis scaling.
- Min Value at Scaling: Sets the minimum value for scaling the Y-axis.
- Max Value at Scaling: Sets the maximum value for scaling the Y-axis.
- Y Axis Position: Determines the position of the Y-axis. Options include:
- Overlay
- Left
- Right
- Visible: Toggles the visibility of the strategy on the chart.
By configuring these visual settings, traders can effectively analyze their strategies' performance by clearly seeing where trades were entered and exited on the chart.