Strategy Creation
The Create the strategy button allows users to generate and build the source code of the generated strategy. This functionality enables users to implement the strategy for further testing or live trading.
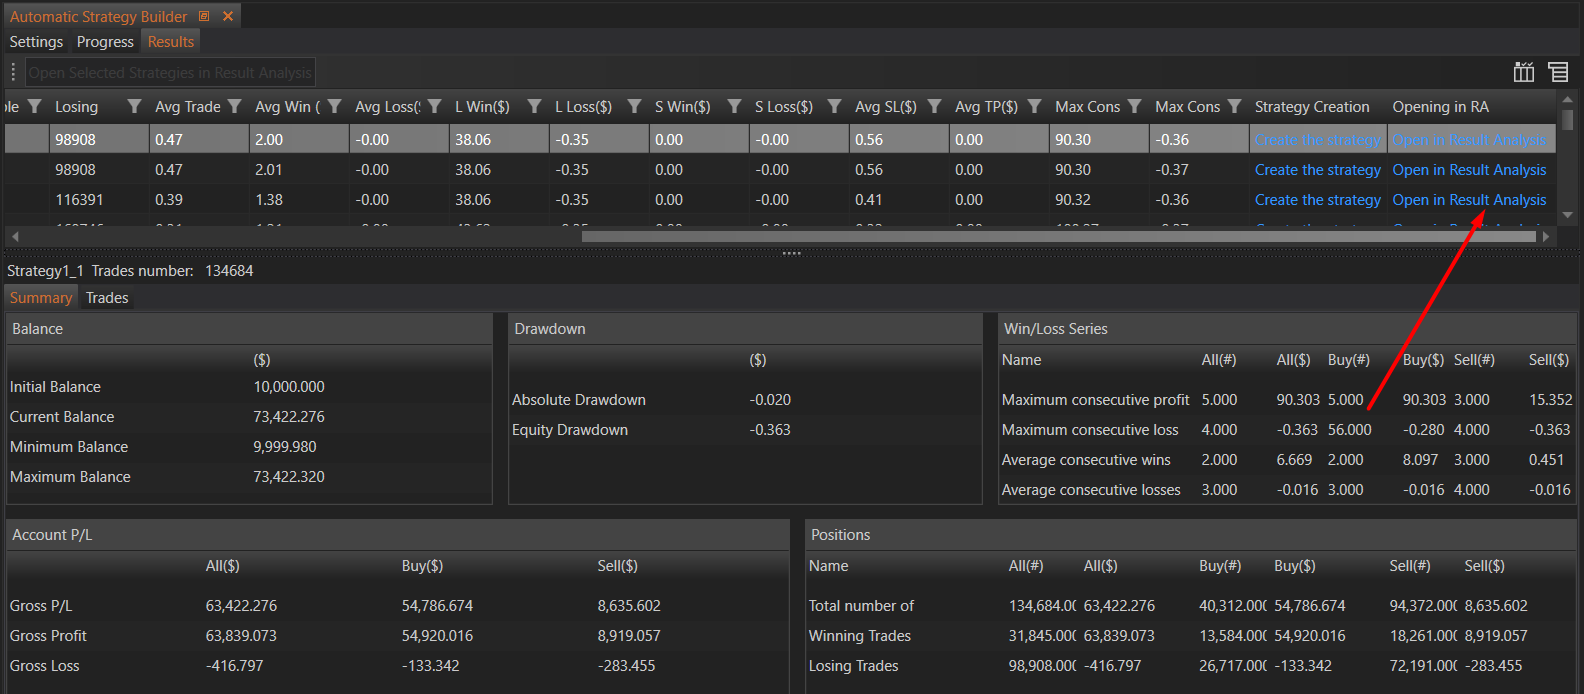
Opening in RA (Result Analysis)
The Open in Trade Analysis button allows users to open the generated strategy in the Result Analysis module for a deeper analysis of the strategy's performance metrics and trade details. This feature provides a detailed examination of the strategy's effectiveness and potential improvements.
Detailed Strategy Information
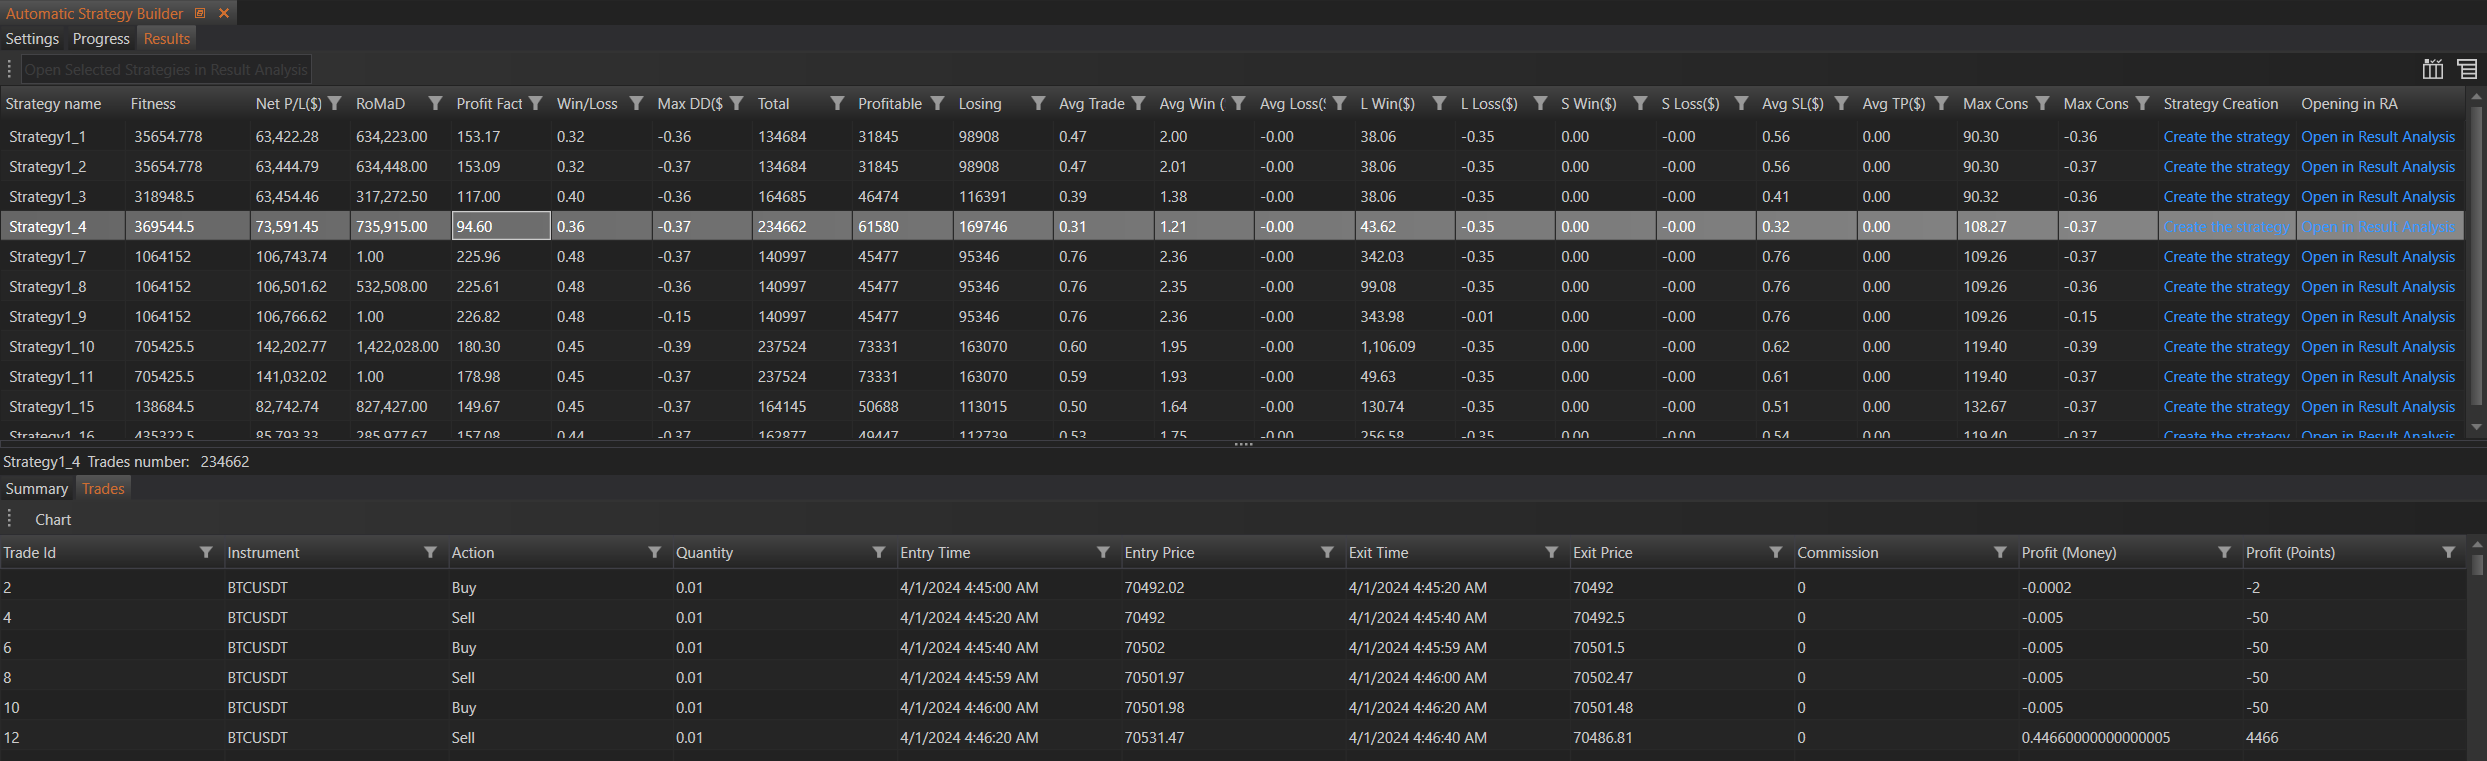
Selecting any generated strategy in the table provides additional information about the strategy, including:
- Summary: A summary of the strategy's performance statistics. Detailed information can be found on the Summary page in the Result Analysis module.
- Trades: A list of trades executed by the strategy, providing a clear view of the strategy's trading history and individual trade performance.
Additional Analysis and Actions
Users have several options for further analysis and actions on the generated strategies:
Open in Result Analysis
To perform additional analysis, users can open any generated strategy in the Result Analysis module by clicking the Open in Trade Analysis button.
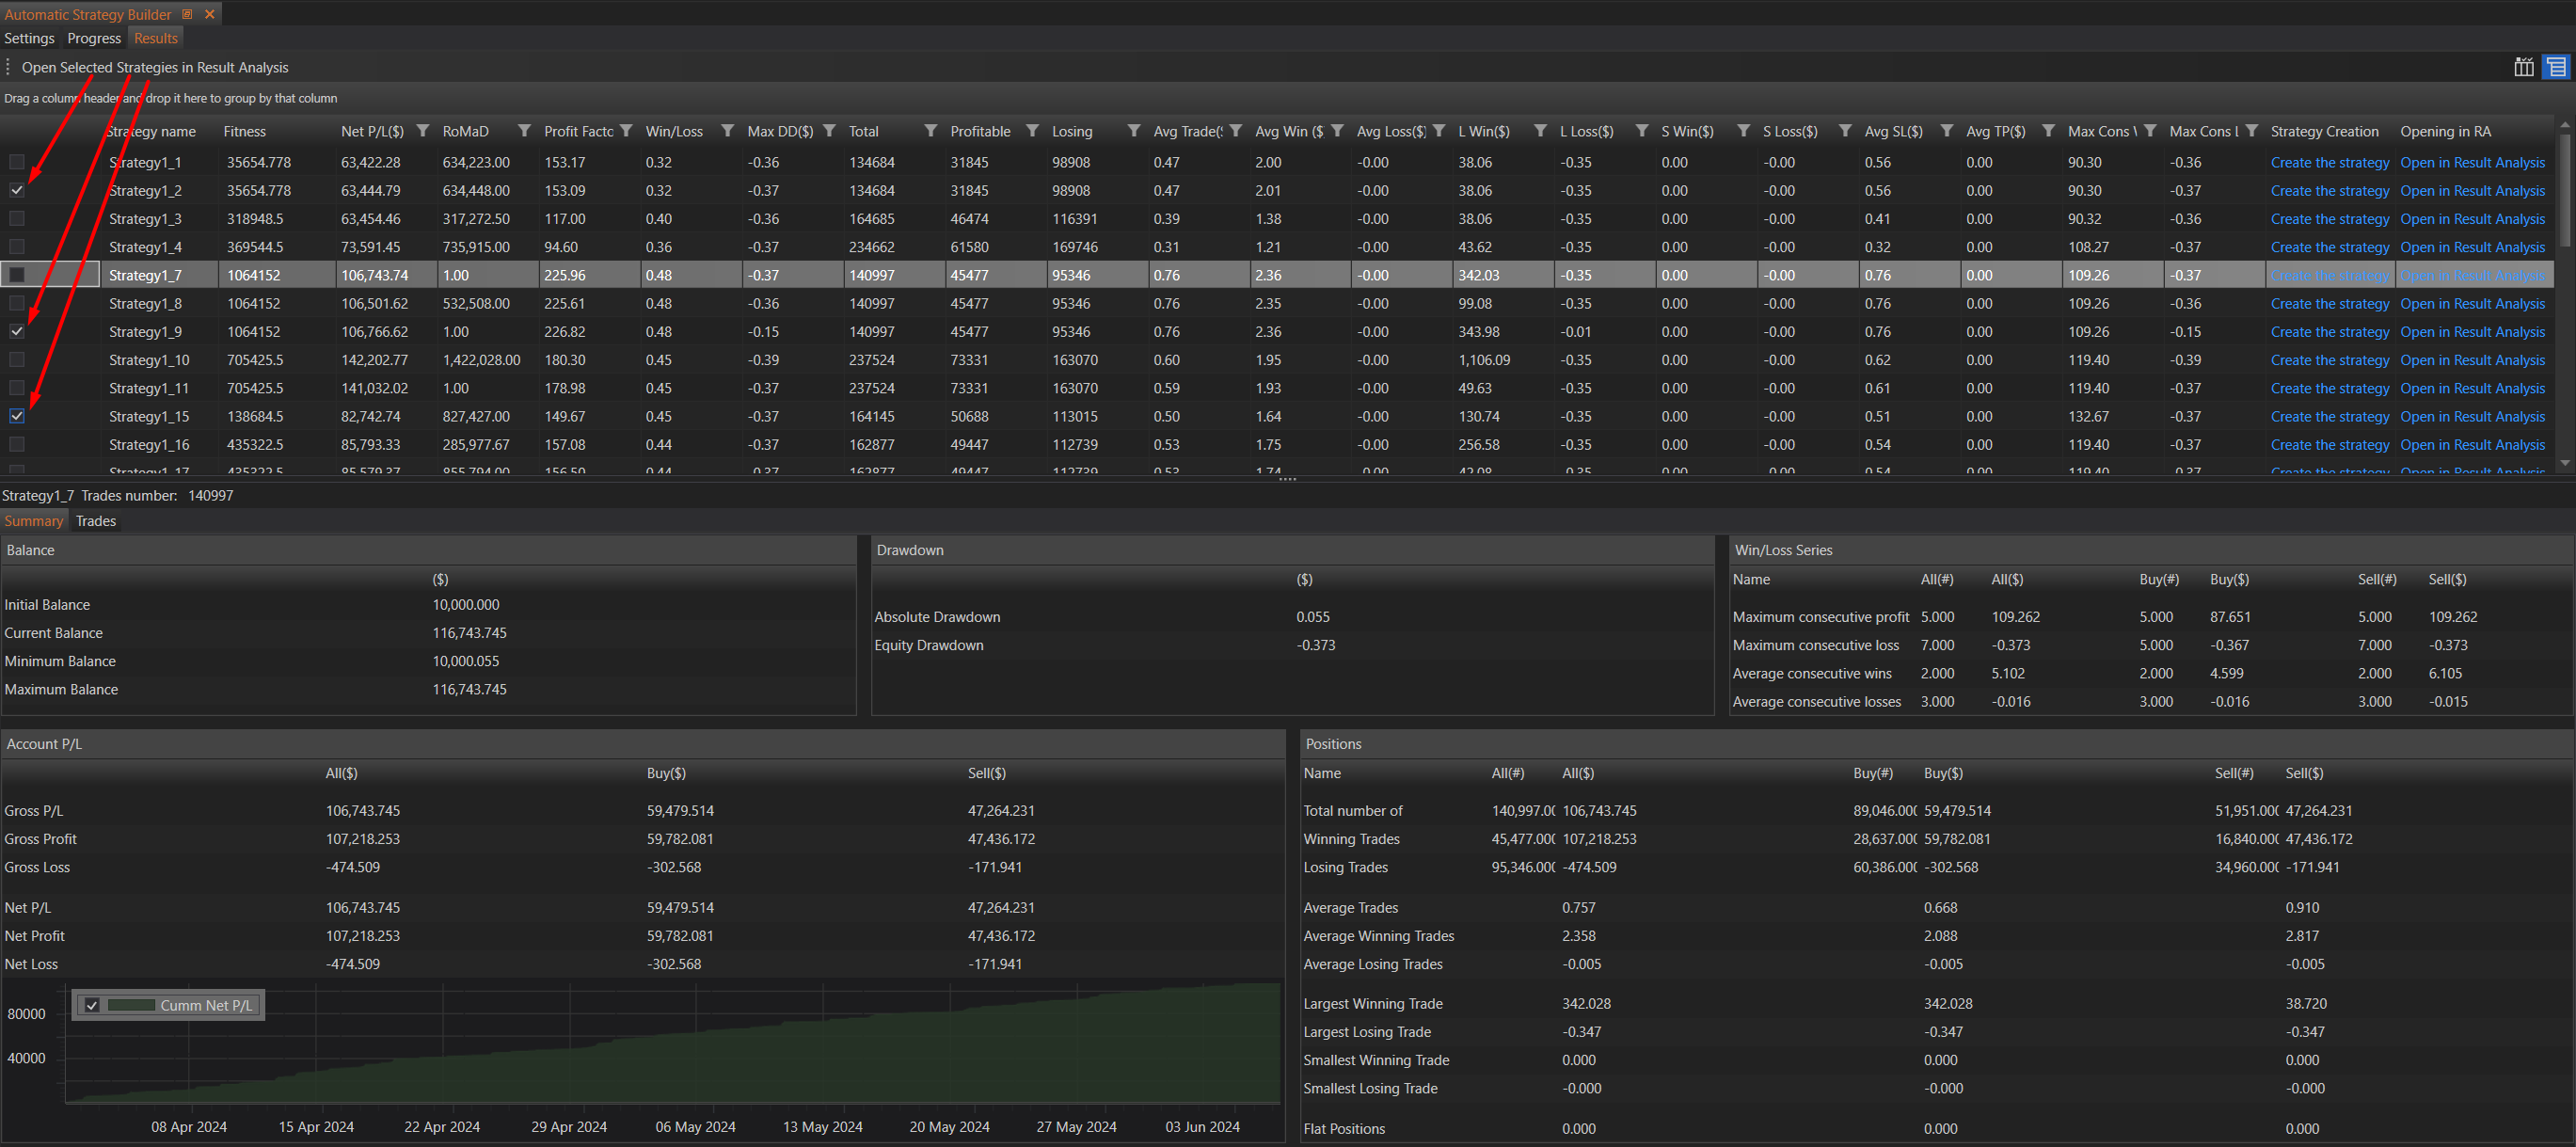
Open Multiple Strategies in Result Analysis
Users can select multiple strategies and click the Open Selected Strategies in Result Analysis button to analyze several strategies at once.
Generate Source Code
For any built strategy, users can generate its source code for use in the backtester or strategy runner. To generate the source code:
- Click the Create the strategy button next to the desired strategy.
- In the dialog window, enter a strategy name and click Ok to generate and build the source code.
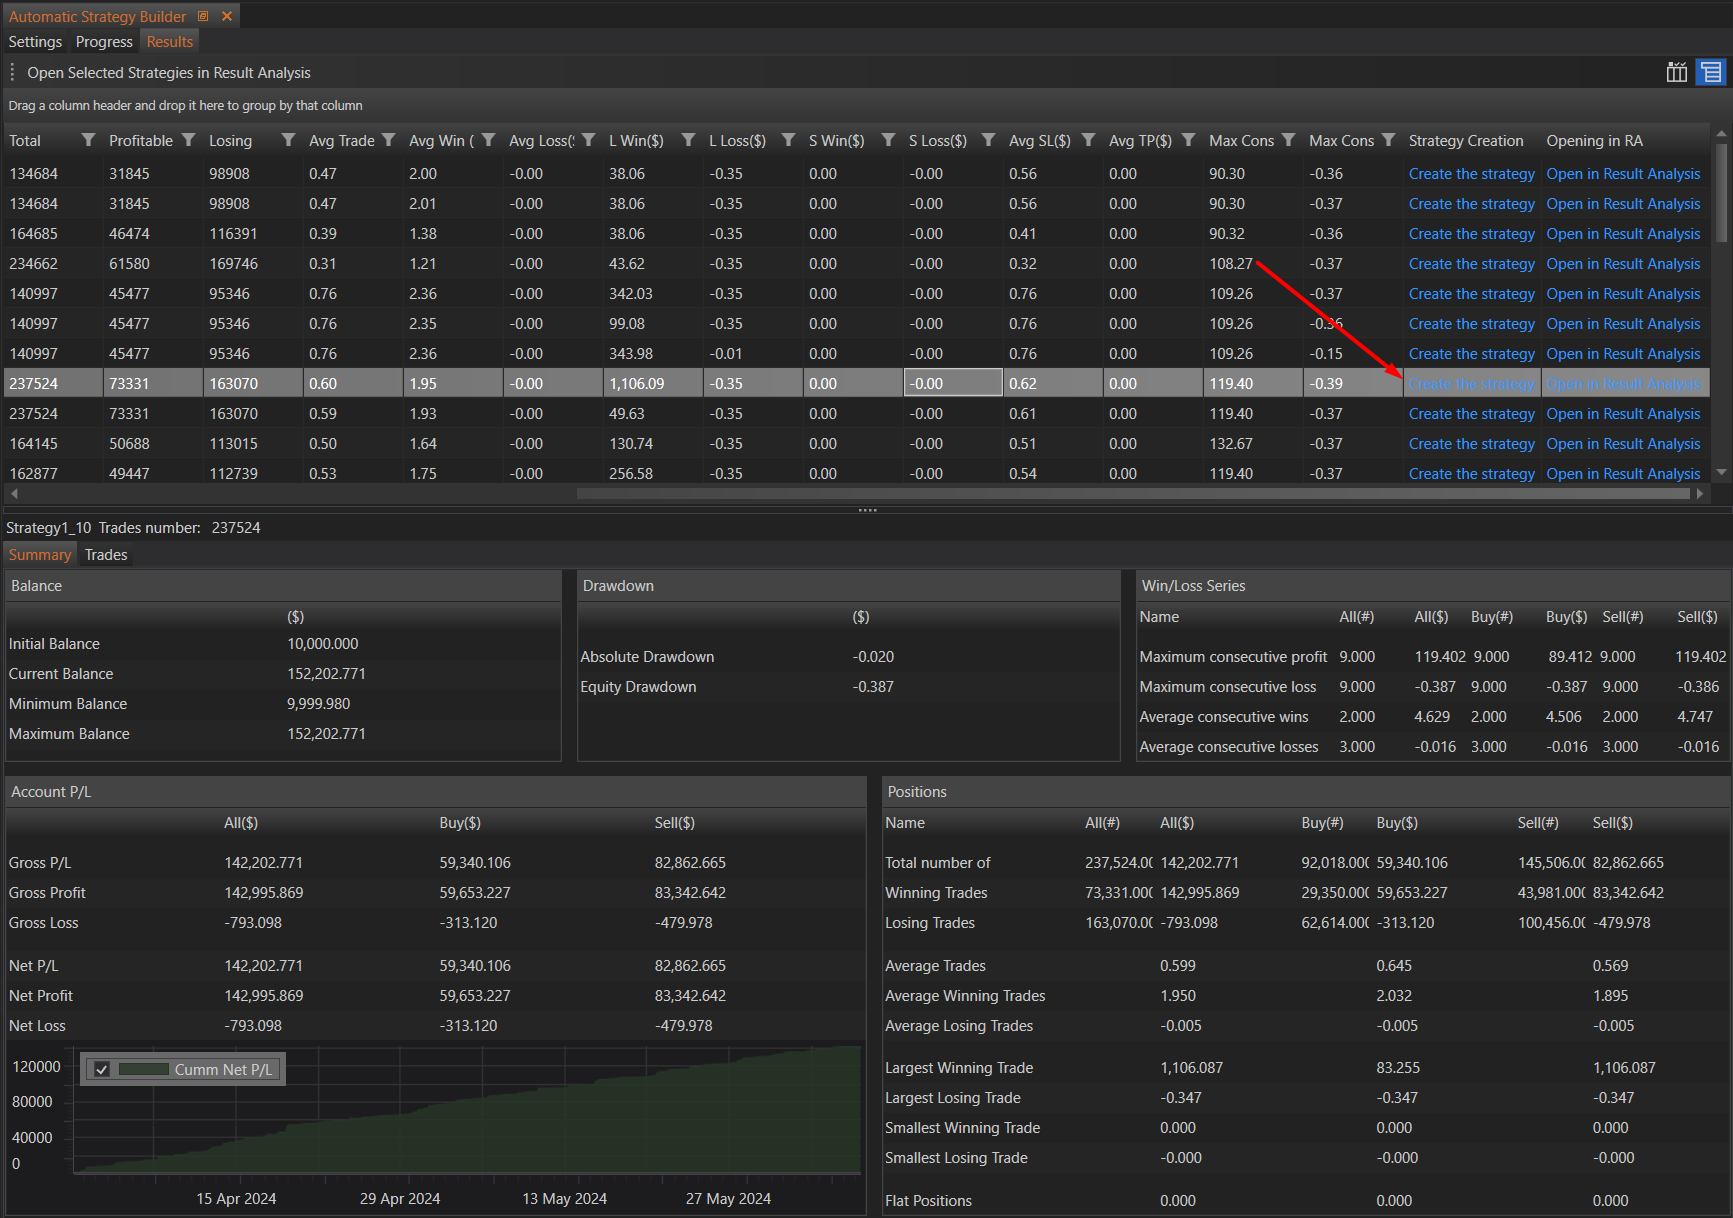
Table Columns
The table in the Results tab includes the following columns, each representing key metrics and information about the generated strategies:
Strategy Name
The name of the generated strategy helps users easily identify and differentiate between multiple strategies.
Fitness
The objective function value of the generated strategy indicates its overall performance based on the chosen fitness criteria. This metric is crucial for comparing different strategies and determining which ones are most effective.
Net P/L
Net profit or loss of the generated strategy measures the overall profitability. This value is essential for understanding how much a strategy would have earned or lost over the backtesting period.
RoMaD (Return to Maximum Drawdown Ratio)
The return to maximum drawdown ratio measures risk-adjusted returns by comparing net profit to the maximum drawdown. This ratio helps assess the efficiency of the strategy in generating returns relative to its risk.
Profit Factor
The profit factor, calculated as gross profit divided by gross loss, indicates the strategy's profitability. A higher profit factor means that the strategy generates significantly more profit compared to its losses.
Win/Loss
The ratio of winning trades to losing trades provides insight into the strategy's overall win rate. This metric helps users understand the likelihood of the strategy producing winning trades.
Max DD (Maximum Drawdown)
The maximum peak-to-trough decline in the strategy's equity represents the worst-case scenario loss. This metric is critical for assessing the risk associated with the strategy.
Total
The total number of trades executed by the strategy shows the strategy's trading activity and frequency. This information is useful for understanding how often the strategy trades.
Profitable
The number of profitable trades highlights the absolute count of winning trades, giving a clear picture of how often the strategy produces positive returns.
Losing
The number of losing trades highlights the absolute count of losing trades, providing insight into the strategy's failure rate.
Avg Trade (Average Trade Profit)
The average profit or loss per trade provides a sense of the strategy's profitability on a per-trade basis. This metric helps evaluate the effectiveness of the strategy on an individual trade level.
Avg Win (Average Winning Trade)
The average profit of winning trades indicates the typical profit on successful trades. This value helps gauge the potential gains from the strategy's winning trades.
Avg Loss (Average Losing Trade)
The average loss of losing trades indicates the typical loss on unsuccessful trades. This metric helps assess the potential downside of the strategy's losing trades.
L Win (Largest Winning Trade)
The largest profit from winning trades shows the maximum profit achieved in a single trade. This information is useful for understanding the best-case scenario for the strategy.
L Loss (Largest Losing Trade)
The largest loss from losing trades shows the maximum loss incurred in a single trade. This value is critical for understanding the potential maximum risk of the strategy.
S Win (Smallest Winning Trade)
The smallest profit from winning trades highlights the minimum profit achieved in a winning trade. This metric provides insight into the least profitable winning trades.
S Loss (Smallest Losing Trade)
The smallest loss from losing trades highlights the minimum loss incurred in a losing trade. This information helps assess the best-case scenario for losing trades.
Avg SL (Average Stop Loss Value)
The average stop loss value set for trades provides insight into the risk management applied in the strategy. This value is important for understanding how the strategy protects against large losses.
Avg TP (Average Take Profit Value)
The average take profit value set for trades indicates the target profit levels used in the strategy. This metric helps assess the strategy's profit-taking approach.
Max Cons W (Maximum Consecutive Wins)
The maximum number of consecutive winning trades shows the strategy's ability to maintain a winning streak. This information is useful for understanding the strategy's performance consistency.
Max Cons L (Maximum Consecutive Losses)
The maximum number of consecutive losing trades shows the strategy's risk of experiencing a losing streak. This metric is important for assessing the potential for extended periods of losses.
Strategy Creation
Create source code of the strategy
Opening in RA
Open strategy in result analysis
Summary
The Results tab in the ASB provides a detailed and comprehensive view of the performance and metrics of generated strategies. By offering options to view detailed information, perform additional analysis, and generate source code, the ASB ensures that users can thoroughly evaluate and implement the most effective strategies. This detailed feedback loop enhances the overall strategy development process, allowing for continuous improvement and optimization of trading strategies.