Skip to main content Skip to footer

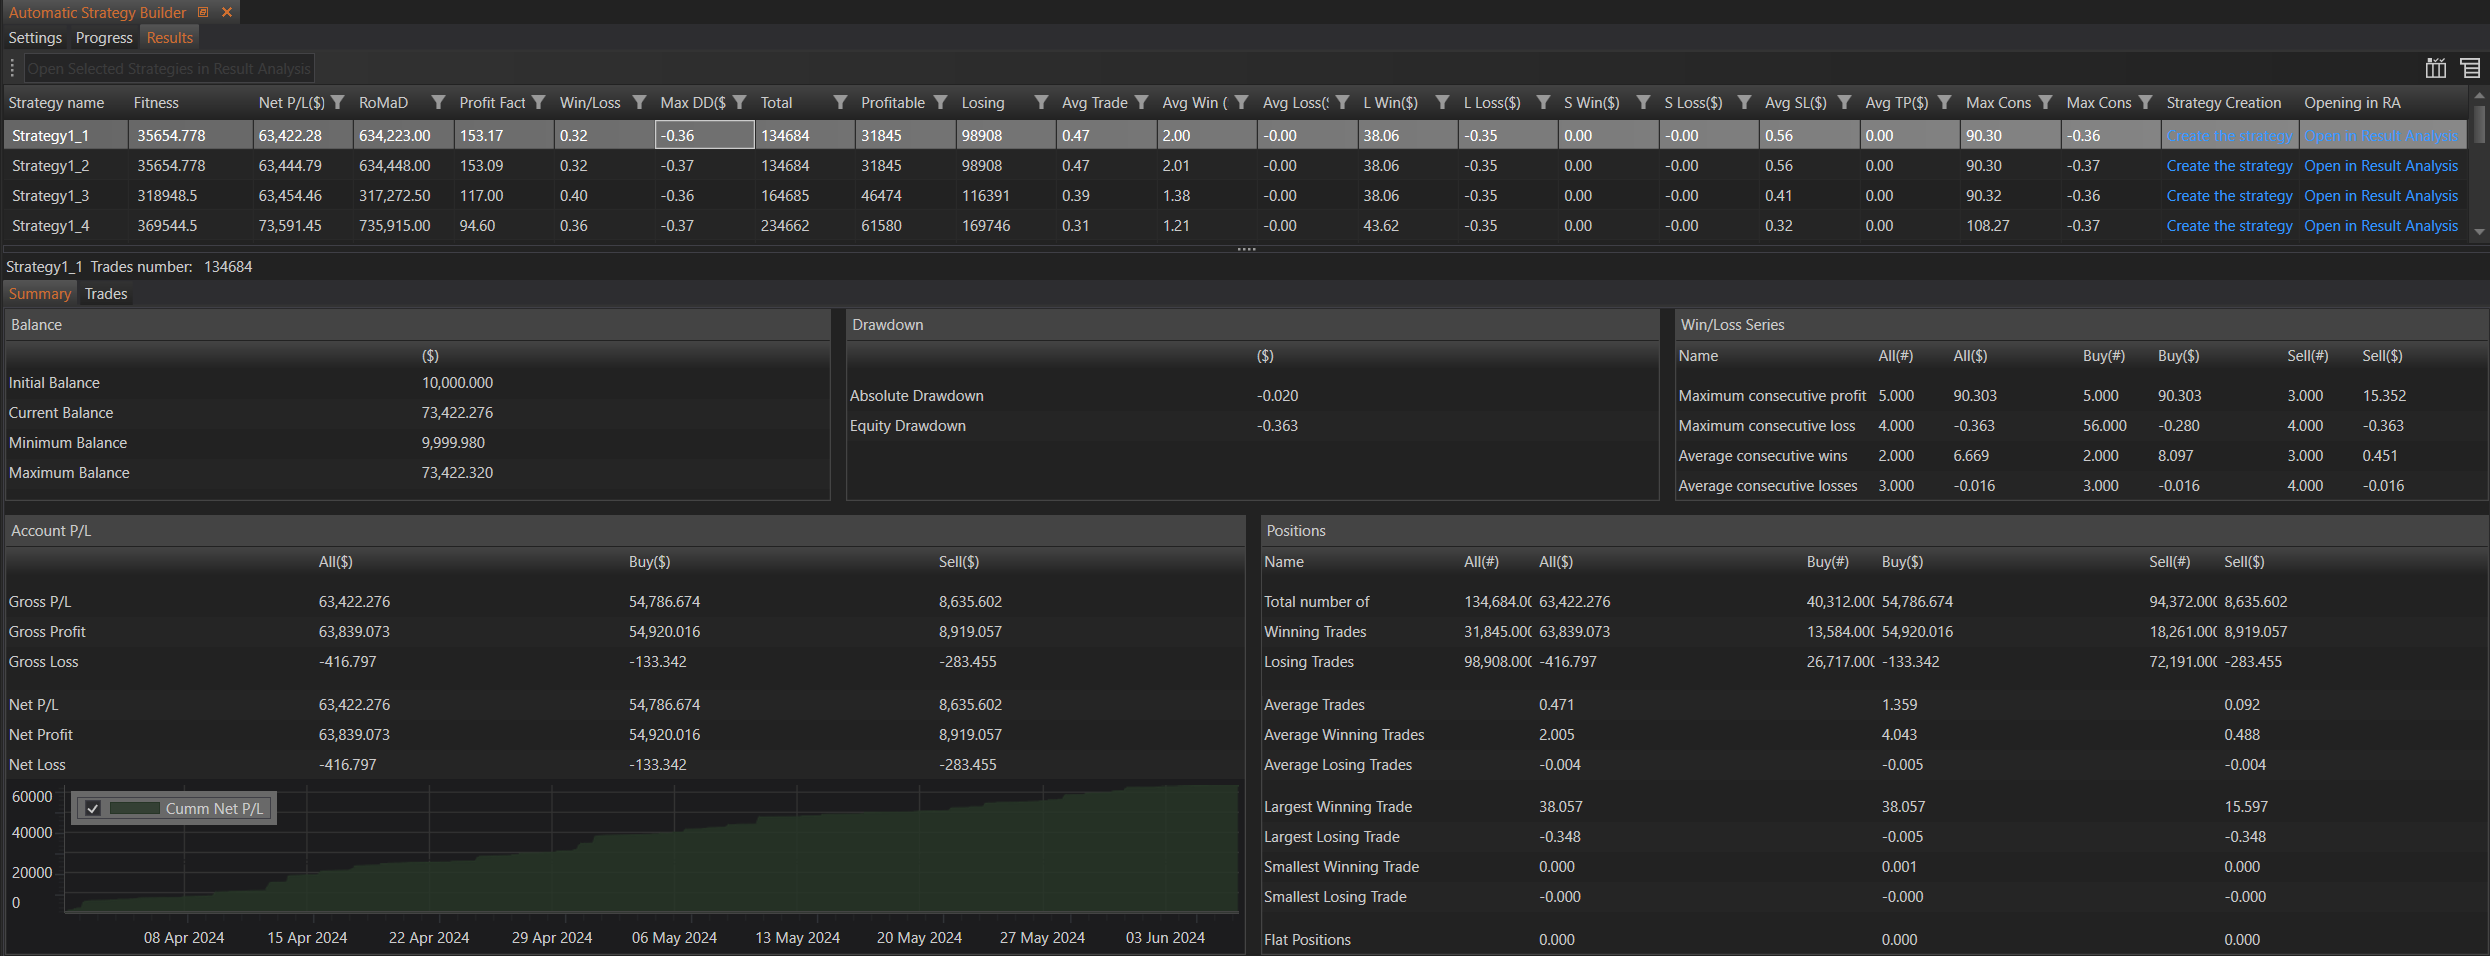
The Summary page in the Results section of the Automatic Strategy Builder (ASB) provides a comprehensive overview of the performance of generated strategies. This page displays detailed statistics and metrics, enabling users to evaluate the effectiveness and robustness of their trading strategies. The page is divided into several key sections: Balance, Drawdown, Win/Loss Series, Account P/L, Positions, and a Cumulative Net P/L Chart.

Balance

This section provides an overview of the account balance over the testing period, helping users understand how the strategy affects the overall account equity.

  • Initial Balance: The starting balance of the account before any trades were executed. This provides a baseline for evaluating performance.

  • Current Balance: The account balance after the last trade of the strategy. This shows the net effect of all trades.

  • Minimum Balance: The lowest account balance recorded during the testing period. This is critical for assessing the risk and drawdowns.

  • Maximum Balance: The highest account balance recorded during the testing period. This indicates the peak performance of the strategy.


Drawdown

This section details the drawdowns experienced by the strategy, which are critical for understanding the risk involved and the strategy's worst-case scenarios.

  • Absolute Drawdown: The difference between the initial balance and the lowest point reached during the testing period. This shows the maximum capital loss from the starting balance.

  • Equity Drawdown: The maximum loss from a peak in the equity curve to the next trough. This metric is essential for understanding the extent of loss the strategy experienced from its highest value.


Win/Loss Series

The Win/Loss Series section provides insights into the patterns of consecutive wins and losses. It helps users understand the consistency and stability of the strategy's performance.

  • Maximum Consecutive Profit: The highest number of consecutive profitable trades and the corresponding total profit.

    • All(#): Maximum consecutive profit for all trades, expressed as the number of trades.

    • All($): Maximum consecutive profit for all trades, expressed in currency.

    • Buy(#): Maximum consecutive profit for buy trades, expressed as the number of trades.

    • Buy($): Maximum consecutive profit for buy trades, expressed in currency.

    • Sell(#): Maximum consecutive profit for sell trades, expressed as the number of trades.

    • Sell($): Maximum consecutive profit for sell trades, expressed in currency.

  • Maximum Consecutive Loss: The highest number of consecutive losing trades and the corresponding total loss.

    • All(#): Maximum consecutive loss for all trades, expressed as the number of trades.

    • All($): Maximum consecutive loss for all trades, expressed in currency.

    • Buy(#): Maximum consecutive loss for buy trades, expressed as the number of trades.

    • Buy($): Maximum consecutive loss for buy trades, expressed in currency.

    • Sell(#): Maximum consecutive loss for sell trades, expressed as the number of trades.

    • Sell($): Maximum consecutive loss for sell trades, expressed in currency.

  • Average Consecutive Wins: The average number of consecutive profitable trades.

    • All(#): Average consecutive wins for all trades, expressed as the number of trades.

    • All($): Average consecutive wins for all trades, expressed in currency.

    • Buy(#): Average consecutive wins for buy trades, expressed as the number of trades.

    • Buy($): Average consecutive wins for buy trades, expressed in currency.

    • Sell(#): Average consecutive wins for sell trades, expressed as the number of trades.

    • Sell($): Average consecutive wins for sell trades, expressed in currency.

  • Average Consecutive Losses: The average number of consecutive losing trades.

    • All(#): Average consecutive losses for all trades, expressed as the number of trades.

    • All($): Average consecutive losses for all trades, expressed in currency.

    • Buy(#): Average consecutive losses for buy trades, expressed as the number of trades.

    • Buy($): Average consecutive losses for buy trades, expressed in currency.

    • Sell(#): Average consecutive losses for sell trades, expressed as the number of trades.

    • Sell($): Average consecutive losses for sell trades, expressed in currency.

Account P/L

This section breaks down the profits and losses of the account, providing a clear picture of the strategy's financial performance.

  • Gross P/L: The total profit or loss before any deductions.

    • Gross Profit: The total profit from all trades.

    • Gross Loss: The total loss from all trades.

  • Net P/L: The total profit or loss after deductions.

    • Net Profit: The profit remaining after losses and costs are deducted.

    • Net Loss: The total loss accounting for all factors.

These parameters provide stats in the following columns:

  • All($): Combined total for all trades.

  • Buy($): Total for buy trades.

  • Sell($): Total for sell trades.


Cumulative Net P/L Chart

This section includes a chart that visually represents the growth of the account balance over time. The Cumulative Net P/L Chart displays the trajectory of net profit and loss, offering a clear visual insight into the strategy's performance. This helps users quickly grasp the overall trend and stability of the strategy's returns.


Positions

The Positions section offers detailed statistics on the trades executed by the strategy, helping users understand the trade dynamics and effectiveness.

  • Total Number of:

    • Winning Trades: The total number of profitable trades.

    • Losing Trades: The total number of losing trades.

  • Average Trades:

    • Average Winning Trades: The average profit per winning trade.

    • Average Losing Trades: The average loss per losing trade.

  • Largest Winning Trade: The most profitable single trade.

  • Largest Losing Trade: The most losing single trade.

  • Smallest Winning Trade: The least profitable winning trade.

  • Smallest Losing Trade: The least losing trade.

  • Flat Positions: The number of trades that neither gained nor lost significantly.

These parameters are displayed in the following columns:

  • All(#): Total number of trades for each statistic.

  • All($): Total amount in currency for each statistic.

  • Buy(#): Number of buy trades for each statistic.

  • Buy($): Amount in currency for buy trades.

  • Sell(#): Number of sell trades for each statistic.

  • Sell($): Amount in currency for sell trades.


Summary

The Summary page in the Results section of the ASB provides a detailed and comprehensive overview of the performance metrics and statistics of the generated strategies. By offering insights into balance changes, drawdowns, win/loss patterns, profits and losses, and detailed trade statistics, the Summary page enables users to thoroughly evaluate the effectiveness and robustness of their trading strategies. The combination of numerical data and visual charts facilitates a deep understanding of strategy performance, aiding in continuous improvement and optimization. This detailed feedback loop is essential for refining strategies and ensuring they meet the desired performance criteria.

Cookies Notice

We use cookies to improve your experience, personalize content, and analyze our traffic. By clicking "Accept All Cookies," you agree to the storing of cookies on your device. You can manage your cookie preferences at any time by visiting our Cookie Settings.