Candlestick Patterns
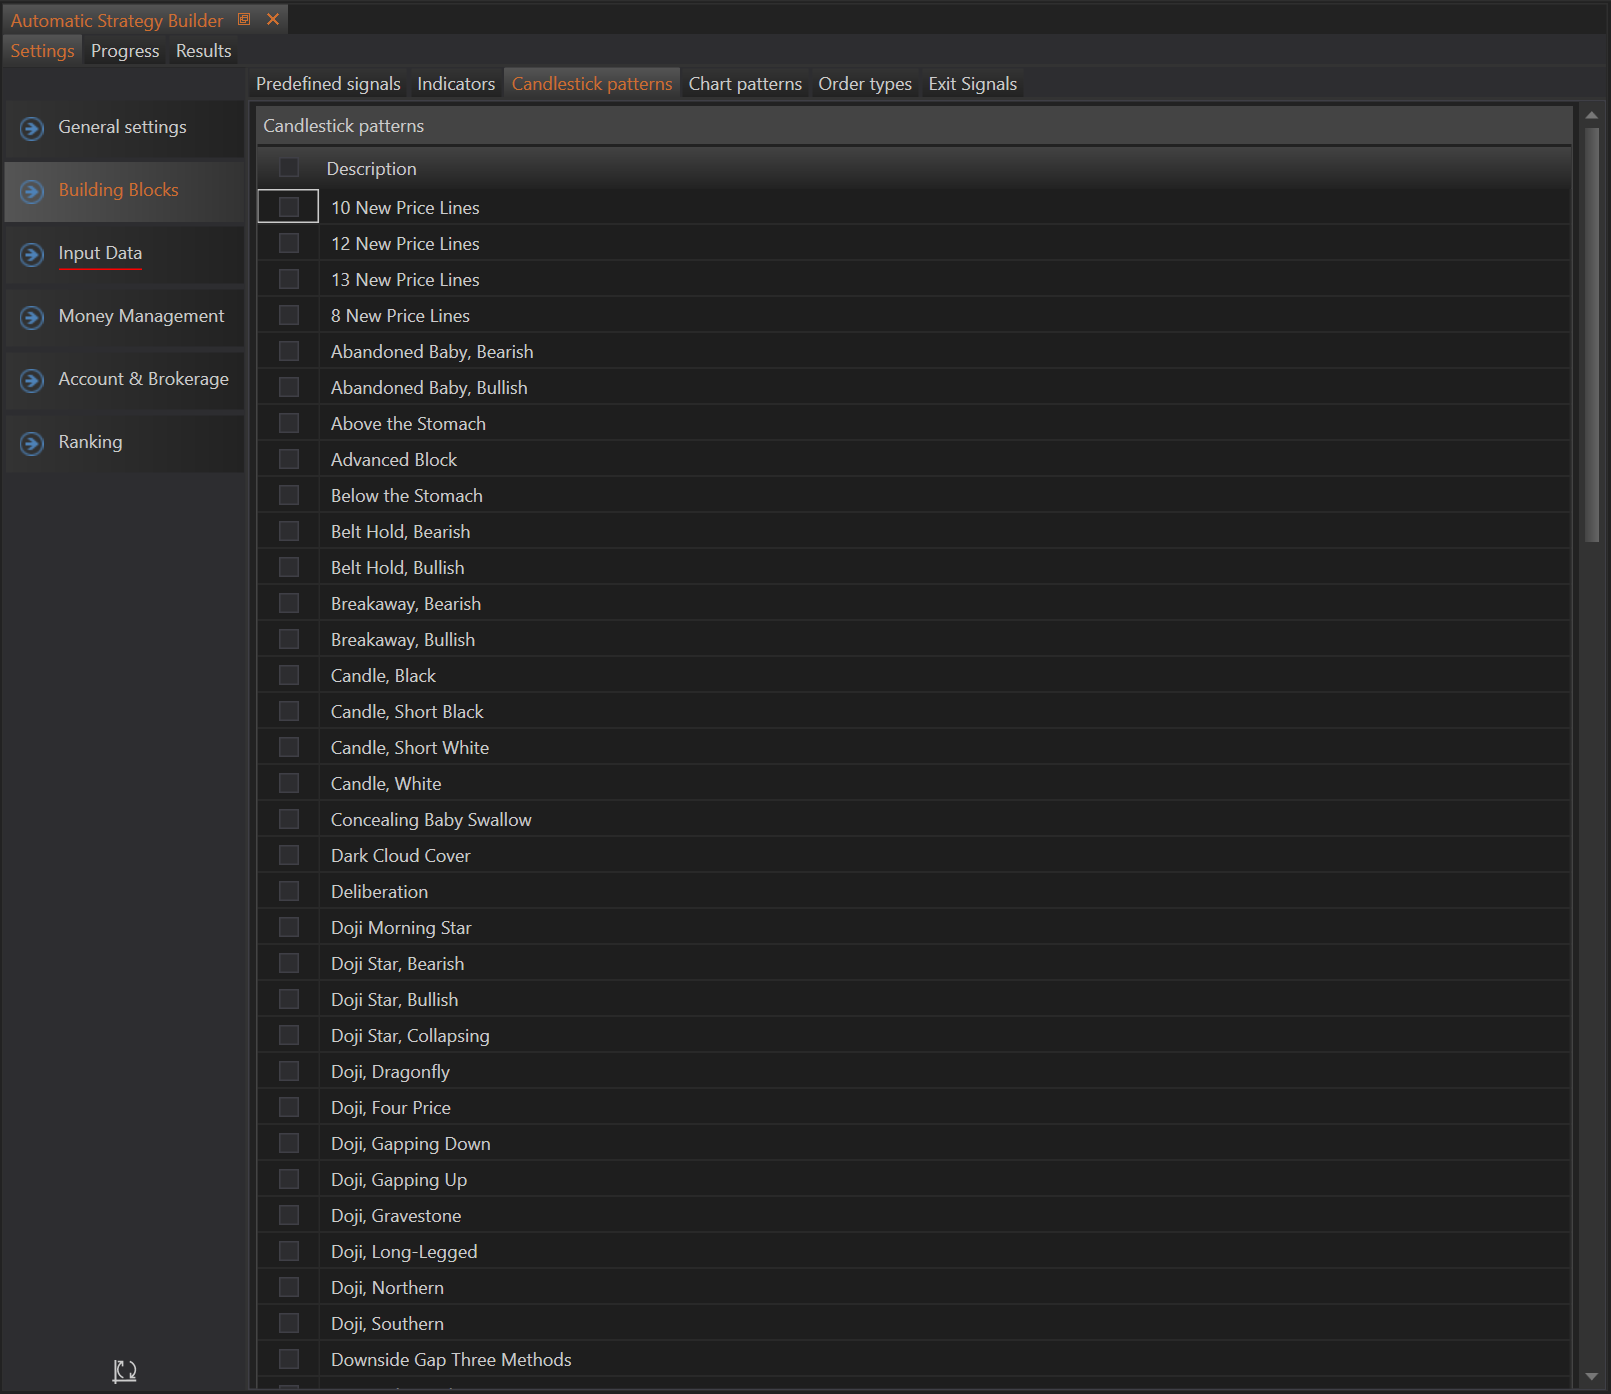
The Candlestick Patterns tab in the Automatic Strategy Builder (ASB) is dedicated to detecting and utilizing various candlestick patterns for creating trading strategies. Users can select the desired patterns, and the builder will incorporate their detection into the strategy creation process.
Overview
Candlestick patterns are a cornerstone of technical analysis, providing insights into potential market movements based on historical price action. The ASB supports a comprehensive array of candlestick patterns, allowing users to leverage these formations to enhance their trading strategies.
Types of Candlestick Patterns
The ASB can detect a wide range of candlestick patterns, including but not limited to:
-
Complex Patterns: Such as "10 New Price Lines," "12 New Price Lines," and "13 New Price Lines," which track sequences of increasing price highs.
-
Classic Reversals: Including "Abandoned Baby" (both bearish and bullish), "Engulfing" patterns, and "Harami" configurations.
-
Continuation Patterns: Like "Rising Three Methods" and "Falling Three Methods," indicating the potential continuation of a current trend.
-
Single Candle Formations: Such as "Doji," "Hammer," and "Shooting Star," each providing quick insights into market sentiment.
-
Unique Formations: Including less common patterns like "Takuri Line" and "Three Stars in the South," offering specialized insights.
Detailed Example of Using Candlestick Patterns
Suppose a user wants to create a strategy that utilizes specific candlestick patterns:
- Navigate to the Candlestick Patterns Tab: Open the Candlestick Patterns tab in the ASB.
- Select Desired Patterns: Check the boxes next to the patterns such as "Hammer," "Bullish Engulfing," and "Rising Three Methods."
- Incorporate into Strategy: The ASB will now detect these patterns in historical data and use their appearances to trigger trades based on the user’s configured rules.
Additional Information on Pattern Utilization
Each selected pattern can be configured to suit the specific needs of the trading strategy. For example, users might want to adjust the sensitivity of the pattern detection or combine multiple patterns to form a more complex trading rule. The ASB allows for such customization, ensuring that strategies can be fine-tuned to align with market conditions and trading goals.
Comprehensive Pattern List
For a complete list of all supported candlestick patterns and further details on their definitions and usage, users can visit the Candlestick Scanner Features page.
Summary
The Candlestick Patterns section in the ASB is a powerful tool for traders looking to incorporate technical candlestick analysis into their strategies. By providing a wide range of patterns and enabling users to select specific formations, the ASB allows for highly customized and effective strategy building. This flexibility ensures that users can tailor their strategies to fit their unique trading styles and market conditions, enhancing the robustness and adaptability of the trading strategies created within the ASB.