Indicators
The Indicators tab in the Automatic Strategy Builder (ASB) is a fundamental tool for creating detailed and effective trading strategies. This section consists of two main tables: Indicators and Conditions.
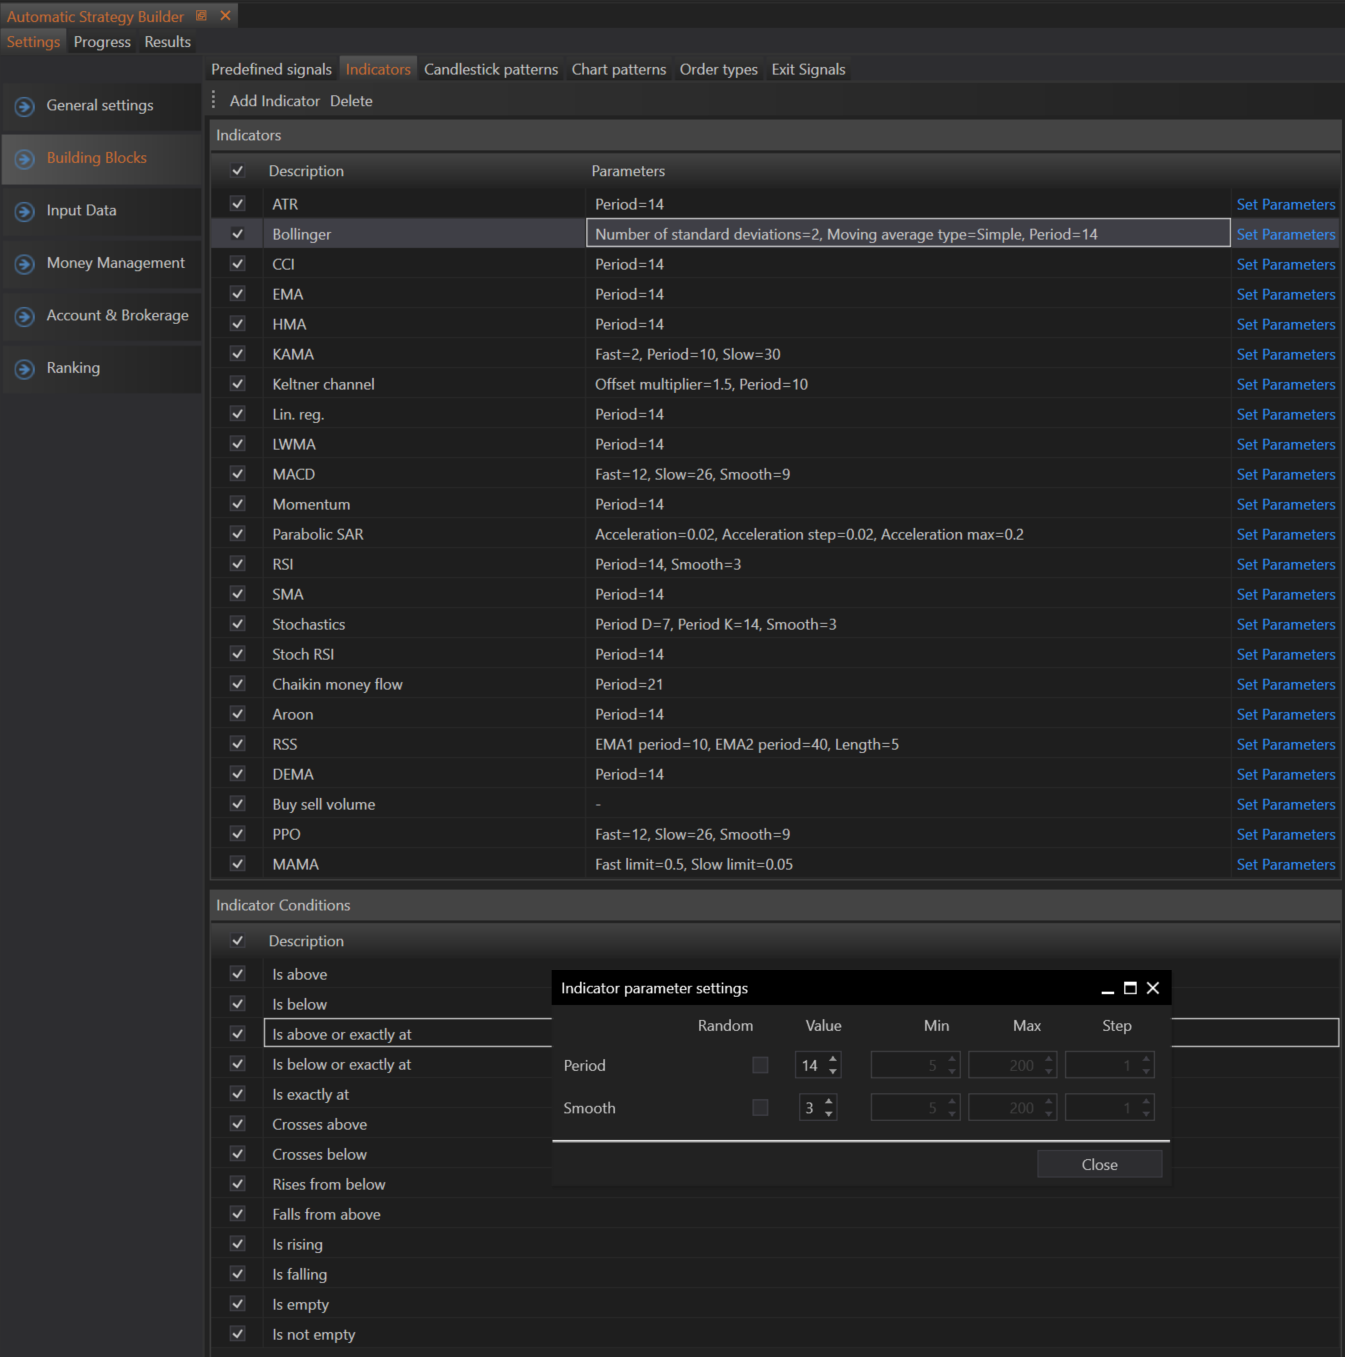
Indicators Table
The Indicators table lists various technical indicators available for strategy building. Users can add, remove, or modify indicators and their parameters, similar to the functionality available for predefined signals. Here is a comprehensive list of the available indicators:
- ATR (Average True Range)
- Bollinger Bands
- CCI (Commodity Channel Index)
- EMA (Exponential Moving Average)
- HMA (Hull Moving Average)
- KAMA (Kaufman Adaptive Moving Average)
- Keltner Channel
- Linear Regression
- LWMA (Linear Weighted Moving Average)
- MACD (Moving Average Convergence Divergence)
- Momentum
- Parabolic SAR
- RSI (Relative Strength Index)
- SMA (Simple Moving Average)
- Stochastics
- Stoch RSI (Stochastic Relative Strength Index)
- Chaikin Money Flow
- Aroon
- RSS (Relative Strength Smoothing)
- DEMA (Double Exponential Moving Average)
- Buy Sell Volume
- PPO (Percentage Price Oscillator)
- MAMA (MESA Adaptive Moving Average)
Adding an Indicator
To add an indicator to the strategy:
- Add Indicator: Click on the "Add Indicator" button. Any indicator present in FinStudio can be added.
- Set Parameters: After adding an indicator, click the "Set Parameters" button to open the Indicator Parameter Settings window.
Configuring Indicator Parameters
In the Indicator Parameter Settings window, users can set the exact parameters for the indicator that will be used in the strategy. The window allows users to:
- Set Fixed Parameters: Manually input specific values for the indicator settings.
- Use Random Settings: Activate random settings by checking the relevant box. This enables the Min, Max, and Step settings.
- Min Value: Set the minimum value for the indicator.
- Max Value: Set the maximum value for the indicator.
- Step Value: Define the step increment for the indicator values.
- Min Value: Set the minimum value for the indicator.
For example, by setting a minimum value of 2, a maximum value of 200, and a step of 2, the strategy builder can use any value from 2 to 200 in multiples of 2. This allows the builder to use indicator values such as 2, 4, 6, 8, ..., 198, 200.
Conditions Table
The Conditions table defines the possible relationships between indicators. The available conditions include:
- Is above
- Is below
- Is above or exactly at
- Is below or exactly at
- Is exactly at
- Crosses above
- Crosses below
- Rises from below
- Rises from above
- Is rising
- Is falling
These conditions determine how indicators interact with each other or with price values. For example, a condition could specify that one indicator must be above another indicator for a trading rule to be triggered.
Using Indicators and Conditions in Trading Rules
To utilize the data from the Indicators tab in building trading rules, users must select at least two indicators and one condition. This selection forms the basis of a trading strategy. For instance, a user might create a rule where the RSI indicator is required to be above a specific value, or where the MACD line crosses above the signal line.
Step-by-Step Example
Let's walk through an example of adding an indicator and setting its parameters:
-
Adding a Moving Average Indicator:
- Click on the "Add Indicator" button.
- Select "SMA (Simple Moving Average)" from the list of indicators.
- Click on the "Add Indicator" button.
-
Setting Parameters for SMA:
- Click the "Set Parameters" button next to the SMA indicator.
- In the Indicator Parameter Settings window, set the period to a fixed value of 50.
- Alternatively, activate the random settings by checking the relevant box:
- Set Min Value to 10.
- Set Max Value to 200.
- Set Step Value to 10.
- Set Min Value to 10.
This configuration allows the strategy builder to use any SMA period between 10 and 200 in multiples of 10, such as 10, 20, 30, and so on.
Advanced Configuration with Random Settings
Using random settings provides flexibility and variability in strategy testing. For example:
- Bollinger Bands Configuration:
- Add "Bollinger Bands" from the list of indicators.
- Set the period to 20 and the standard deviation to 2 (fixed settings).
- Alternatively, for random settings:
- Min Period: 10
- Max Period: 50
- Step: 5
- Min Std Dev: 1
- Max Std Dev: 3
- Step: 0.5
- Min Period: 10
- Add "Bollinger Bands" from the list of indicators.
This setup allows the Bollinger Bands indicator to vary its period between 10 and 50 in steps of 5, and the standard deviation between 1 and 3 in steps of 0.5, enabling more comprehensive strategy testing.
Building a Strategy with Indicators and Conditions
To build a trading rule:
- Select Indicators: Choose at least two indicators from the Indicators table.
- Define Condition: Select at least 1 condition from the Conditions table, such as "Crosses above."
Summary
The Indicators section in the ASB is designed to provide users with the flexibility and tools needed to build sophisticated trading strategies. By offering a wide range of indicators and conditions, the ASB ensures that users can tailor their strategies to meet specific trading objectives and market conditions. This level of customization enhances the effectiveness and adaptability of the trading strategies created within the ASB.