What Are Drawings
Drawings are auxiliary elements in the Manual Strategy Builder (MSB) that are attached to the chart alongside the strategy. These script units enhance the visual representation of the strategy's performance and can provide additional insights directly on the trading chart.
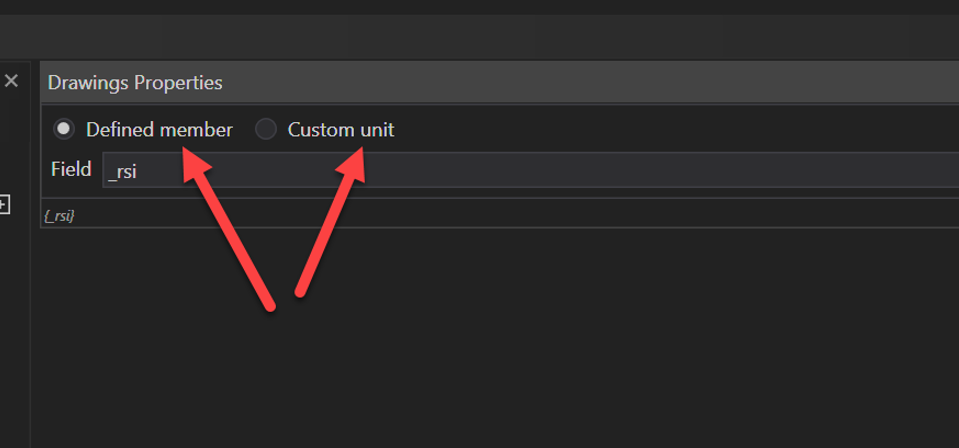
Defining Drawings
Drawings are used to visually represent data on the chart. They can be linked to an indicator from a declared member or involve creating a new instance of an indicator. For instance, a drawing might display the output of an RSI indicator or highlight specific market conditions such as support and resistance levels.
Types of Drawings
Drawings can encompass various forms, such as lines, shapes, or text annotations that help traders interpret the data generated by their strategies. These visual aids are crucial for quick analysis and decision-making, offering a graphical summary of the algorithm’s output and significant market events.
Linking to Indicators
One of the primary uses of drawings is to visually represent indicators that are referenced from declared members. This means that if a private member is used to define an indicator, such as the RSI, a drawing can be created to display the RSI’s values on the chart. This visual linkage enhances the clarity and usability of the strategy, making it easier for traders to see how the strategy responds to market changes in real time.
Creating New Instances
In addition to linking to existing indicators, new indicator instances can also be created specifically for the purpose of drawing. This flexibility allows traders to add multiple layers of visual data to their charts, tailored to their specific needs and preferences.
Conclusion
Drawings play a significant role in the Manual Strategy Builder by providing essential visual context to the trading strategies. By attaching script units to the chart, they offer an enhanced understanding of the strategy’s performance and facilitate quicker, more informed trading decisions. Whether linking to existing indicators or creating new instances, drawings ensure that critical data is presented in a clear, actionable format directly on the trading interface.