Kagi charts are a type of financial chart used by technical traders to visualize price movements and identify potential buy and sell signals. These charts have a long history that dates back to the 19th century, when they were first developed by a Japanese rice trader named Homma. Kagi charts are unique in that they are not based on time, like other chart types such as bar charts or candlestick charts, but instead are based on price changes. In this article, we will discuss the history of Kagi charts, the basic principles behind their construction, how they are used by traders, and some of the pros and cons of using Kagi charts in trading.
History of Kagi Charts
The Kagi chart is a product of Japanese financial market history and can be traced back to the 19th century, when a Japanese rice trader named Homma discovered that the price of rice was not directly related to the supply and demand for the commodity. He realized that market sentiment, which was driven by emotions such as greed and fear, was the main factor affecting rice prices. To better understand and track market sentiment, Homma created the Kagi chart as a way to visualize price movements based on changes in market sentiment rather than time.
Basic Principles of Kagi Charts
Kagi charts are constructed by drawing a line between two points on a price chart. The first point is the current price, and the second point is either a predetermined support or resistance level. The direction of the line is determined by the direction of the price movement. If the price is moving up, the line is drawn up, and if the price is moving down, the line is drawn down. The thickness of the line is determined by the magnitude of the price move.
The key feature of Kagi charts is that they only change direction when a specified price level is reached. This level is called a reversal threshold, and it is usually set to a percentage of the previous price move. Once the reversal threshold is reached, the line changes direction and a new line is drawn in the opposite direction.
Usage of Kagi Charts
Kagi charts are primarily used by technical traders as a tool for identifying potential buy and sell signals. Traders look for breakouts and reversals in the direction of the Kagi line, which indicate a change in market sentiment. When the line changes direction, traders interpret this as a signal to either buy or sell.
One of the advantages of using Kagi charts is that they provide a clear visual representation of price movements and market sentiment, making it easier for traders to identify potential trading opportunities. Another advantage is that they can be used in a variety of markets, including stocks, currencies, commodities, and more.
Examples of Trading with Kagi Charts
Traders can use Kagi charts to identify potential buy and sell signals in a variety of markets. For example, a trader might use a Kagi chart to track the price of a stock. If the Kagi line changes direction, indicating a shift in market sentiment, the trader might interpret this as a signal to either buy or sell the stock.
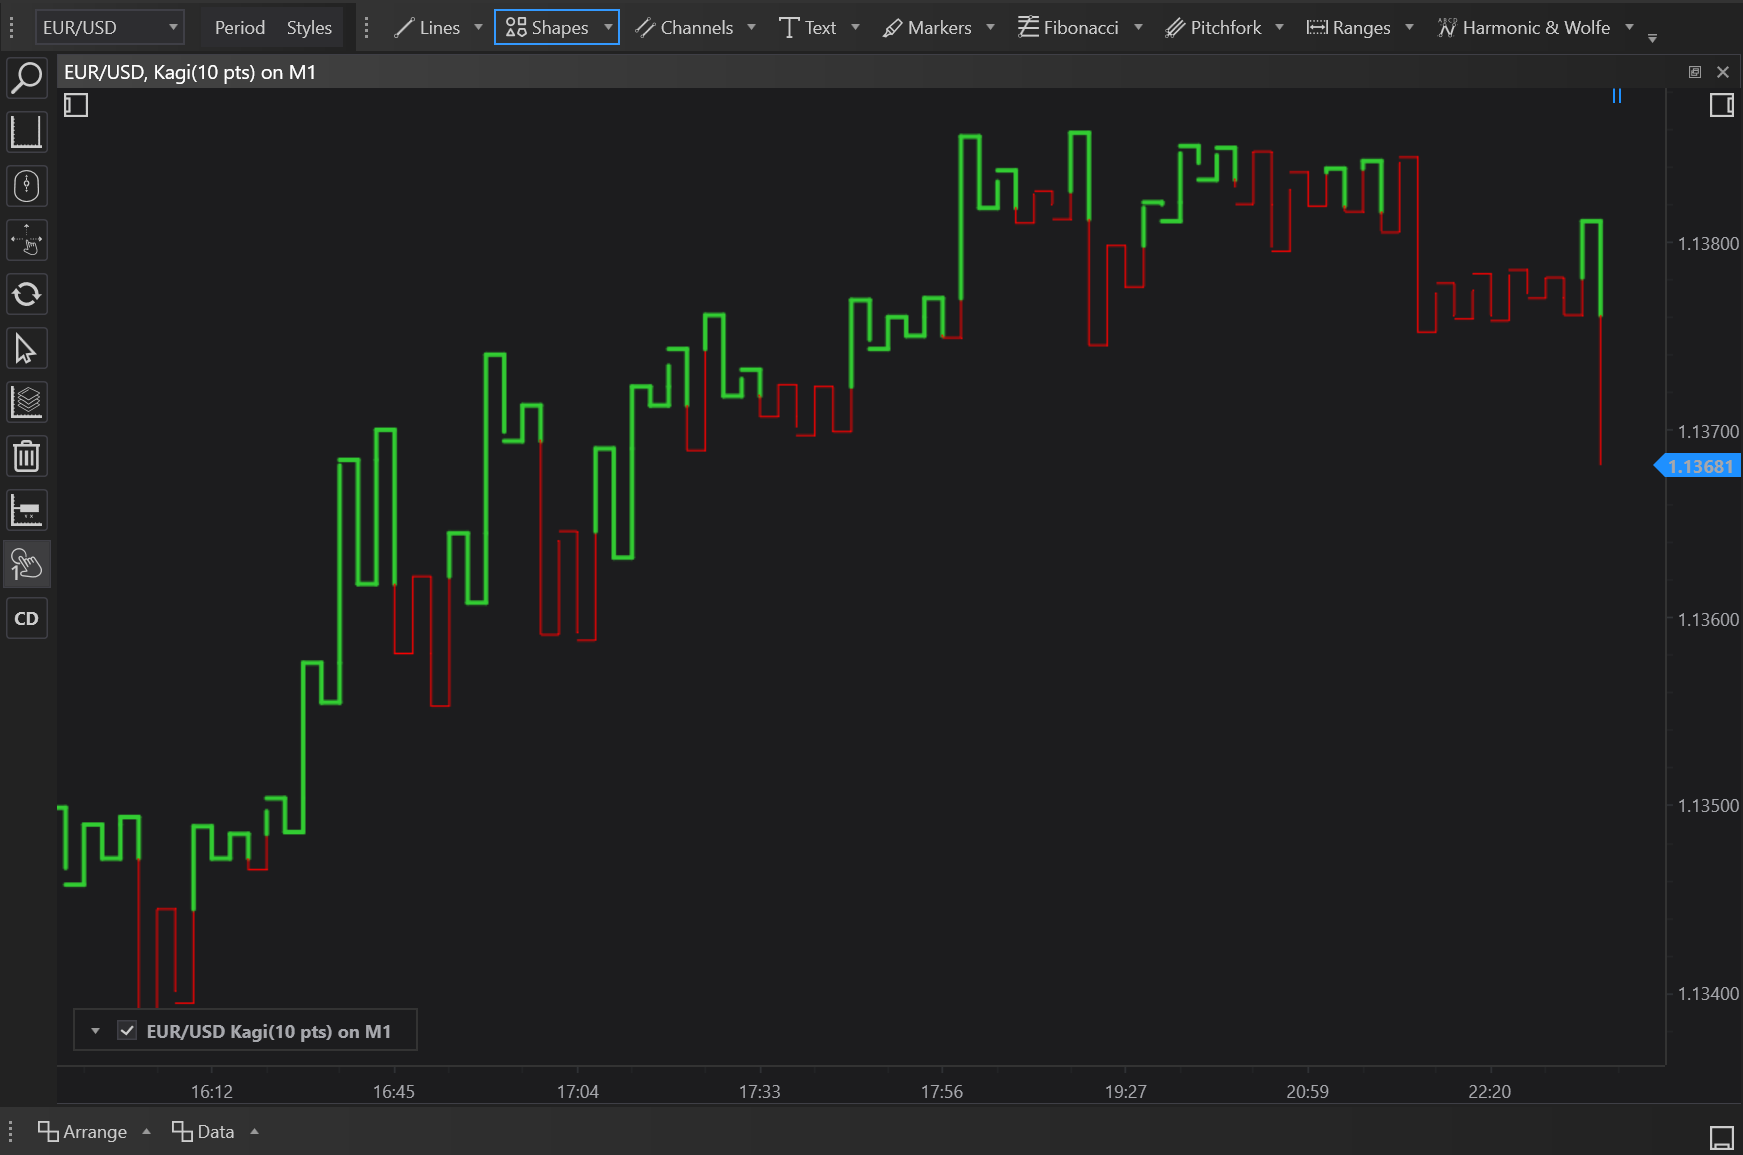
Another example is using Kagi charts in forex trading. In forex, traders use Kagi charts to track the price movements of currency pairs. By analyzing the direction and magnitude of the Kagi line, traders can identify potential buying or selling opportunities in the currency market.
Pros and Cons of Trading with Kagi Charts
Like any trading tool, Kagi charts have both positive and negative aspects. One of the positives is that Kagi charts provide a clear visual representation of price movements and market sentiment, making it easier for traders to identify potential trading opportunities. They also have the advantage of being able to be used in a variety of markets, including stocks, currencies, commodities, and more.
On the negative side, Kagi charts can be more subjective compared to other chart types, such as bar charts or candlestick charts, because they are based on the interpretation of the trader. This means that different traders may come to different conclusions about the same chart. In addition, Kagi charts can be prone to false signals and false breakouts, which can result in traders making incorrect trading decisions.
Another potential drawback of Kagi charts is that they can be less effective in trending markets, where prices are consistently moving in one direction. In these markets, Kagi charts can generate many false signals and result in a high frequency of trades, which can be detrimental to a trader's performance.
Pros of Trading with Kagi Charts:
-
Clear visual representation of price movements: Kagi charts provide a clear and simple visual representation of price movements, which makes it easier for traders to identify trends and make trading decisions.
-
Emphasis on price changes: Kagi charts focus on price changes, which can be an advantage for traders who are looking to trade based on price action rather than technical indicators.
-
Less noise: Kagi charts eliminate the noise that is often present in other types of financial charts. This makes it easier for traders to see the underlying trend and make trading decisions based on this trend.
-
Ability to track long-term trends: Kagi charts are able to track long-term trends, which can be useful for traders who are looking to hold positions for an extended period of time.
Cons of Trading with Kagi Charts:
-
Limited technical analysis: The lack of information on Kagi charts can make it more challenging for traders to perform technical analysis and make informed trading decisions.
-
Limited customization options: The rigid structure of Kagi charts means that traders have limited options for customizing the chart to their specific needs.
-
Absence of trend confirmation indicators: Kagi charts do not support common trend confirmation indicators, such as moving averages or oscillators, which can make it difficult for traders to confirm trends and make informed trading decisions.
-
No volume data: Kagi charts do not display volume data, which is a crucial aspect of market sentiment and helps traders gauge the strength of trends.
Kagi charts are a type of financial chart that have been used by traders for over a century. They are based on the principle that market sentiment, rather than time, is the primary driver of price movements. Kagi charts are constructed by drawing a line between two points on a price chart and only change direction when a specified price level is reached. They are primarily used by technical traders as a tool for identifying potential buy and sell signals, and can be used in a variety of markets.
While Kagi charts have some advantages, such as providing a clear visual representation of price movements and market sentiment, they also have some drawbacks, including subjectivity and the potential for false signals and false breakouts. As with any trading tool, traders should carefully consider the pros and cons of using Kagi charts before incorporating them into their trading strategies.