Line Break Charts are a type of financial chart used by technical traders to visualize price movements and identify potential buy and sell signals. Line Break Charts have a relatively short history compared to other chart types, having been introduced in the late 20th century. In this article, we will discuss the history of Line Break Charts, the basic principles behind their construction, how they are used by traders, and some of the pros and cons of using Line Break Charts in trading.
History of Line Break Charts
Line Break Charts were introduced in the late 20th century by Steve Nison, a technical analyst and author of several books on technical analysis. Nison was one of the first traders to popularize the use of Japanese candlestick charts in the Western world, and he also introduced Line Break Charts as a new type of financial chart. The concept behind Line Break Charts was inspired by the work of Japanese trader, Goichi Hosoda, who developed a similar type of chart known as the kagi chart.
Basic Principles of Line Break Charts
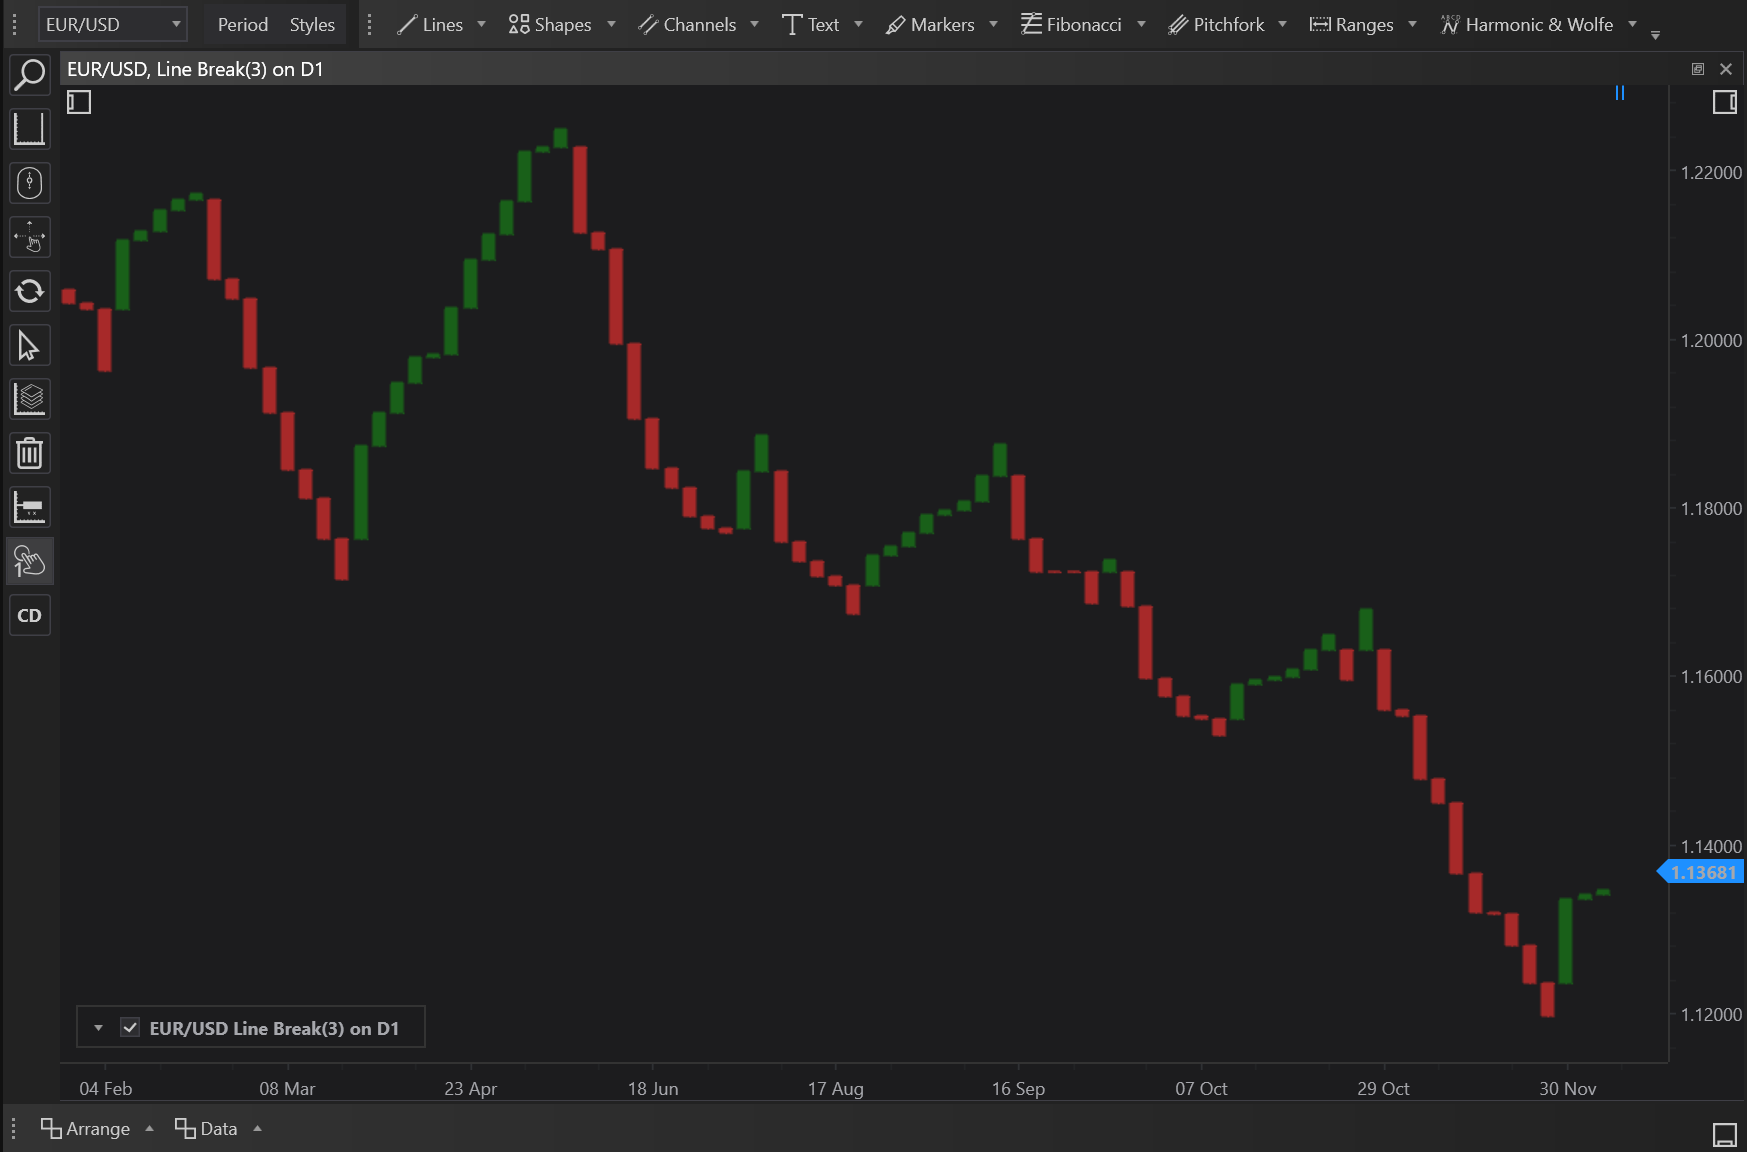
Line Break Charts are constructed by plotting vertical lines to represent price movements. The chart is built by plotting a vertical line for each price increase and a vertical line for each price decrease. The length of the lines is determined by the amount of price change, and can be customized to suit the individual trader's needs. Unlike other chart types, Line Break Charts do not use horizontal time or volume scales. Instead, the chart is time-independent, meaning that the time interval between price changes is not taken into account.
One of the key features of Line Break Charts is that they filter out small price movements and only plot significant changes. This helps traders focus on the most important price movements and ignore insignificant fluctuations. The chart is also designed to highlight trends and reversal patterns, making it easier for traders to identify potential buy and sell signals.
Usage of Line Break Charts
Line Break Charts are used by technical traders as a tool for identifying potential buy and sell signals. Traders look for trends and reversal patterns in the chart, which indicate a change in market sentiment. When the chart shows a trend or reversal pattern, traders interpret this as a signal to either buy or sell.
Line Break Charts can be used in a variety of markets, including stocks, currencies, commodities, and more. They are particularly useful for traders who focus on medium to long-term trading and are looking for a clear and straightforward representation of price movements.
Examples of Trading with Line Break Charts
Traders can use Line Break Charts to identify potential buy and sell signals in a variety of markets. For example, a trader might use a Line Break Chart to track the price of a stock. If the chart shows a trend or reversal pattern, the trader might interpret this as a signal to either buy or sell the stock.
Another example is using Line Break Charts in forex trading. In forex, traders use Line Break Charts to track the price movements of currency pairs. By analyzing the vertical lines, traders can identify potential buying or selling opportunities in the currency market.
Pros and Cons of Trading with Line Break Charts
Like any trading tool, Line Break charts have both positive and negative aspects. One of the positives is that Line Break charts are simple and easy to understand, making them a great tool for new traders who are just starting to explore technical analysis. They also provide a clear visual representation of market trends and price movements, making it easier for traders to identify potential buying and selling opportunities.
However, Line Break charts are also limited in their ability to provide detailed information about market conditions. Unlike other chart types, Line Break charts do not take into account volume or other market indicators, which can be important in making trading decisions. In addition, the simplicity of Line Break charts means that they may not be suitable for traders who are looking for more detailed information about market conditions.
Pros of Trading with Line Break Charts:
-
Simplicity: Line Break charts are a very simple and straightforward type of chart, making it easier for traders to understand and interpret price movements. The charts only show the price trend, eliminating the need for indicators or other technical analysis tools.
-
Unemotional: Line Break charts are not influenced by emotions, which can sometimes lead traders to make irrational decisions. Because the charts only show price movements, traders can make decisions based on objective market data rather than emotions.
-
Trend Focus: Line Break charts are designed to emphasize the trend of the market, making it easier for traders to identify potential trading opportunities. The charts show the direction and strength of the trend, allowing traders to enter or exit trades based on this information.
-
Dynamic: Line Break charts are dynamic in nature, meaning that they change and adapt in real-time as the market changes. This allows traders to quickly and easily stay up-to-date on market conditions.
Cons of Trading with Line Break Charts:
-
Limited Information: Line Break charts only show price movements, eliminating other important market data such as volume and open interest. This can make it difficult for traders to make informed trading decisions without incorporating other market data into their analysis.
-
No Indicators: Line Break charts do not incorporate indicators, which can make it more challenging for traders to identify potential trading opportunities and market trends.
-
Limited Timeframe: Line Break charts only show price movements over a limited timeframe, making it difficult for traders to analyze market trends over a longer period.
-
No Support & Resistance Levels: Line Break charts do not show support and resistance levels, which are important for traders in determining potential trading opportunities and risk management.
In conclusion, Line Break charts are a simple and straightforward type of chart that can be useful for traders who are looking for a clear and unemotional representation of price movements. However, the lack of other market data and the absence of indicators can make it challenging for traders to make informed trading decisions. Traders should consider both the positive and negative aspects of Line Break charts and determine if they are the right tool for their trading strategy.