Point & Figure (P&F) charts are a type of financial chart used by technical traders to visualize price movements and identify potential buy and sell signals. These charts have a long history that dates back to the late 19th century, when they were first used by Charles Dow, one of the founders of Dow Jones & Company and the creator of the Dow Jones Industrial Average. P&F charts are unique in that they are not based on time or volume, like other chart types, but instead are based solely on price changes. In this article, we will discuss the history of Point & Figure charts, the basic principles behind their construction, how they are used by traders, and some of the pros and cons of using Point & Figure charts in trading.
History of Point & Figure Charts
Point & Figure charts were first introduced by Charles Dow in the late 19th century as a way to track price movements in the stock market. Dow was a journalist and investor who is considered to be one of the pioneers of technical analysis. He recognized that stock prices were driven by supply and demand, and he sought to develop a charting method that would help traders identify potential buy and sell signals based on changes in supply and demand.
Basic Principles of Point & Figure Charts
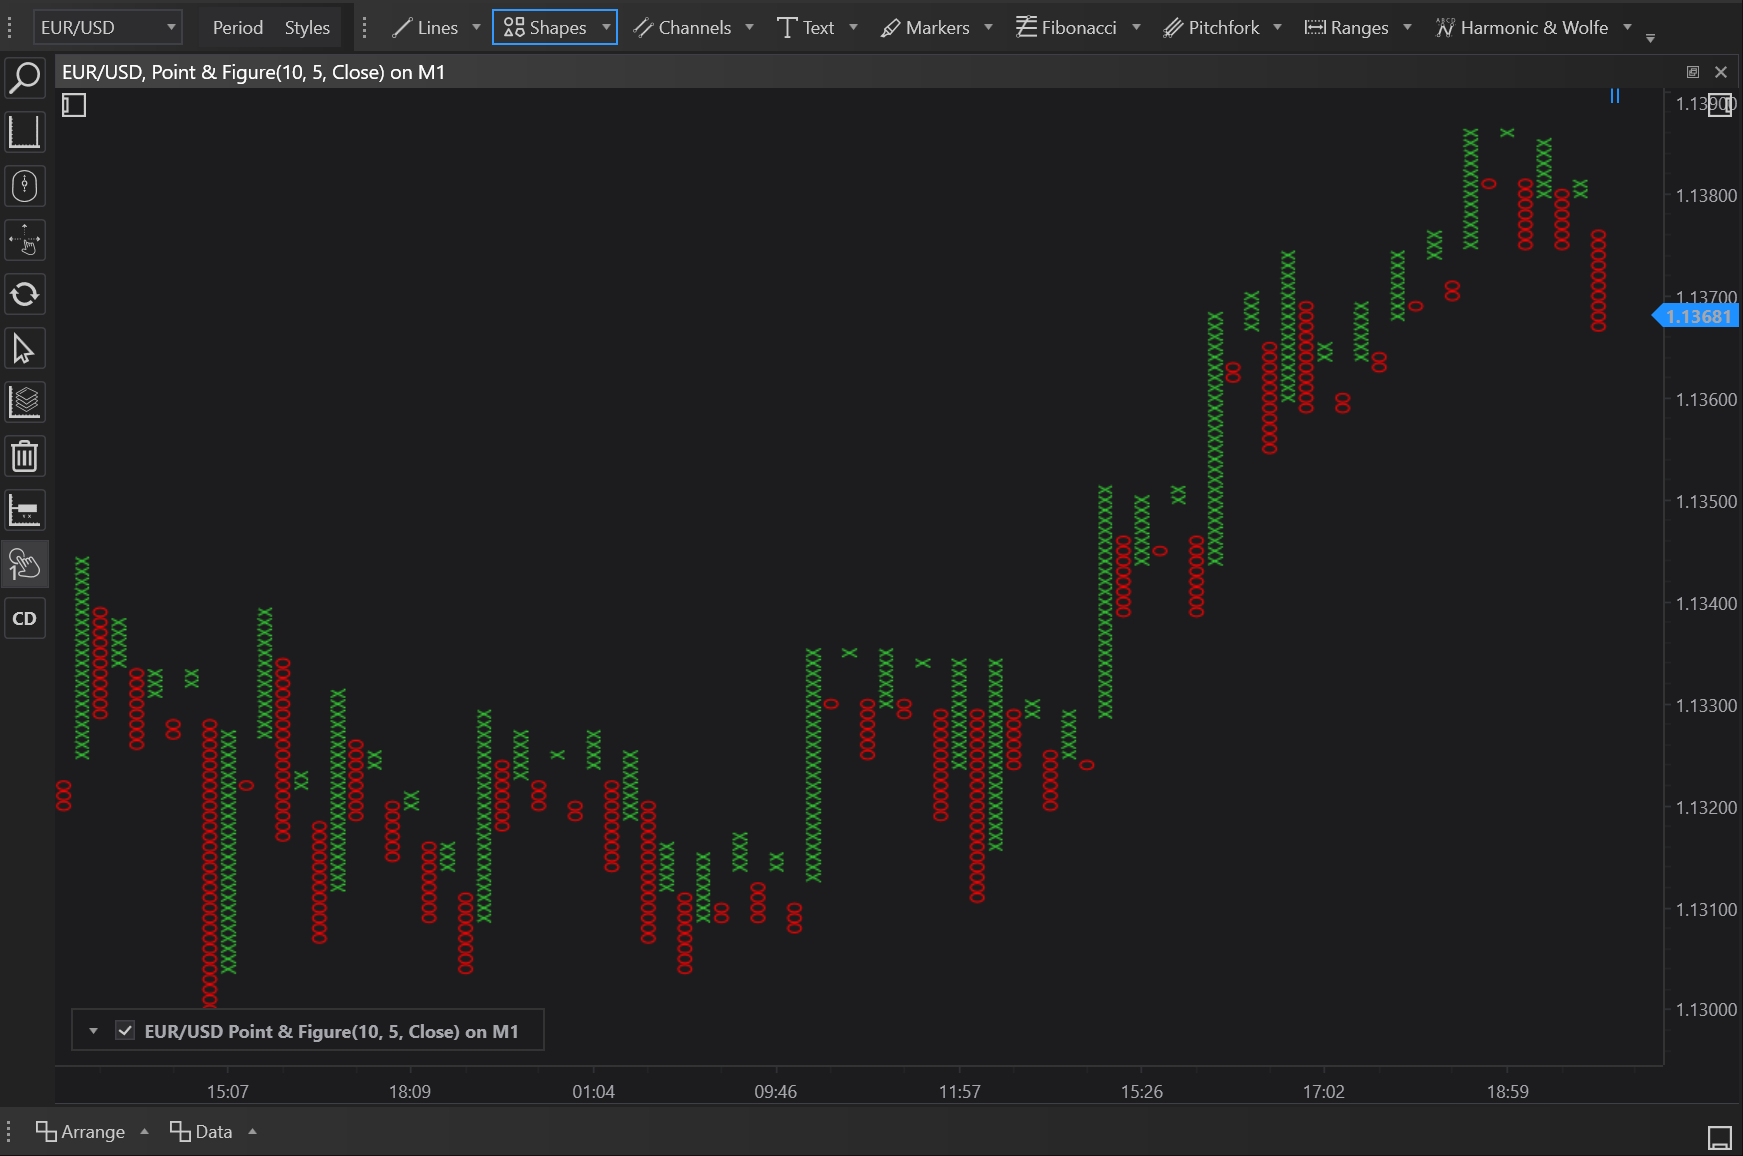
Point & Figure charts are constructed by plotting price changes in a unique X and O format. X's are used to represent rising prices, and O's are used to represent falling prices. The chart is built by plotting an X for each price increase and an O for each price decrease. The size of the X and O columns is determined by the amount of price change and can be customized to suit the individual trader's needs.
One of the key features of Point & Figure charts is that they filter out small price movements and only plot significant changes. This helps traders focus on the most important price movements and ignore insignificant fluctuations. The chart is also time-independent, meaning that the time interval between price changes is not taken into account. This allows traders to focus on the price movements without being influenced by time.
Usage of Point & Figure Charts
Point & Figure charts are primarily used by technical traders as a tool for identifying potential buy and sell signals. Traders look for price breakouts and reversal patterns in the chart, which indicate a change in market sentiment. When the chart shows a breakout or reversal pattern, traders interpret this as a signal to either buy or sell.
Point & Figure charts can be used in a variety of markets, including stocks, currencies, commodities, and more. They are particularly useful for traders who focus on medium to long-term trading and are looking for a clear and straightforward representation of price movements.
Examples of Trading with Point & Figure Charts
Traders can use Point & Figure charts to identify potential buy and sell signals in a variety of markets. For example, a trader might use a Point & Figure chart to track the price of a stock. If the chart shows a breakout or reversal pattern, the trader might interpret this as a signal to either buy or sell the stock.
Another example is using Point & Figure charts in forex trading. In forex, traders use P&F charts to track the price movements of currency pairs. By analyzing the X and O columns, traders can identify potential buying or selling opportunities in the currency market.
Pros and Cons of Trading with Point & Figure Charts
Like any trading tool, Point & Figure charts have both positive and negative aspects. One of the positives is that P&F charts provide a clear visual representation of price movements and market sentiment, making it easier for traders to identify potential trading opportunities. They also have the advantage of filtering out small price movements, which helps traders focus on the most significant changes in the market. Additionally, Point & Figure charts are time-independent, which can help traders avoid being influenced by short-term price fluctuations and instead focus on the overall price trend.
However, there are also some disadvantages to trading with Point & Figure charts. One of the biggest is that they may not be as comprehensive as other chart types, such as candlestick charts or bar charts, which can provide more information about price movements and market sentiment. P&F charts also require a certain level of interpretation, as they do not provide as much detail as other chart types, which can make it difficult for inexperienced traders to make informed trading decisions.
In addition, Point & Figure charts can also be misleading in certain market conditions, as they do not take into account volume or time-based price movements. For example, if a stock's price is steadily rising over time, the P&F chart may not reflect the underlying momentum, which could lead traders to make incorrect buy or sell decisions.
Pros of Trading with Point & Figure Charts
-
Clear Visual Representation: Point & Figure charts provide a clear and straightforward visual representation of price movements and market sentiment, making it easier for traders to identify potential trading opportunities.
-
Filters Out Small Price Movements: P&F charts filter out small price movements and only plot significant changes, which helps traders focus on the most important price movements and ignore insignificant fluctuations.
-
Time-Independent: P&F charts are time-independent, meaning that the time interval between price changes is not taken into account. This allows traders to focus on the price movements without being influenced by time.
-
Identifying Trends and Reversals: Point & Figure charts can help traders identify trends and reversal patterns, which are key indicators of market sentiment and potential trading opportunities.
-
Versatile: Point & Figure charts can be used in a variety of markets, including stocks, currencies, commodities, and more.
Cons of Trading with Point & Figure Charts
-
Lack of Time Consideration: While the time-independence of Point & Figure charts can be a positive aspect, it can also be a negative aspect for traders who require time-based information to make informed trading decisions.
-
Limited Price Detail: P&F charts only plot significant price movements, which can limit the amount of detailed information available to traders. This can make it difficult for traders to make precise trading decisions, especially in fast-moving markets.
-
Can Lead to Overreliance on Charts: While Point & Figure charts can provide useful information for traders, they can also lead to overreliance on chart patterns and signals. This can result in traders making poor trading decisions based on false or unreliable signals.
-
Not Suitable for Short-Term Trading: Point & Figure charts are not well-suited for short-term trading, as they only plot significant price movements and can take longer to reflect changes in market sentiment.
In conclusion, Point & Figure charts are a useful tool for technical traders who are focused on medium to long-term trading. They provide a clear visual representation of price movements and market sentiment and can help traders identify trends and reversal patterns. However, they are not well-suited for short-term trading, lack time-based information, and can lead to overreliance on chart patterns and signals. As with any trading tool, traders should use Point & Figure charts as part of a broader, well-rounded trading strategy that takes into account multiple sources of information.