Range charts are a type of financial chart that are used by traders to track the price movement of an asset over a certain period of time. The main difference between range charts and traditional candlestick or bar charts is that range charts focus solely on price movement, without taking into account the time element. This makes range charts a popular choice among traders who are looking to simplify their trading analysis and focus on the price action.
History and Origin of Range Charts
Vicente Nicolellis was a Brazilian trader and broker who was trading in the 1990s in a market that was both unstable and unpredictable. During this time, he experienced long periods of price consolidation, which made it difficult for him to predict the market with any degree of certainty. Frustrated with this situation, he conducted a careful and lengthy study and came to the conclusion that eliminating time from the formation of price bars would reduce the volatility he was facing. This led him to develop a new type of price bar that only used price data, rather than time.
This new type of price bar, which he called a range bar, was formed only when a specified price range had been achieved, rather than based on time. This meant that a long period of price consolidation could be condensed into just a few bars, removing the noise in the market. As a result of his efforts, Vicente Nicolellis is considered the creator of range bars and his innovation has since been adopted by many traders around the world as a way of better understanding the market.
Basic Principles of Range Charts
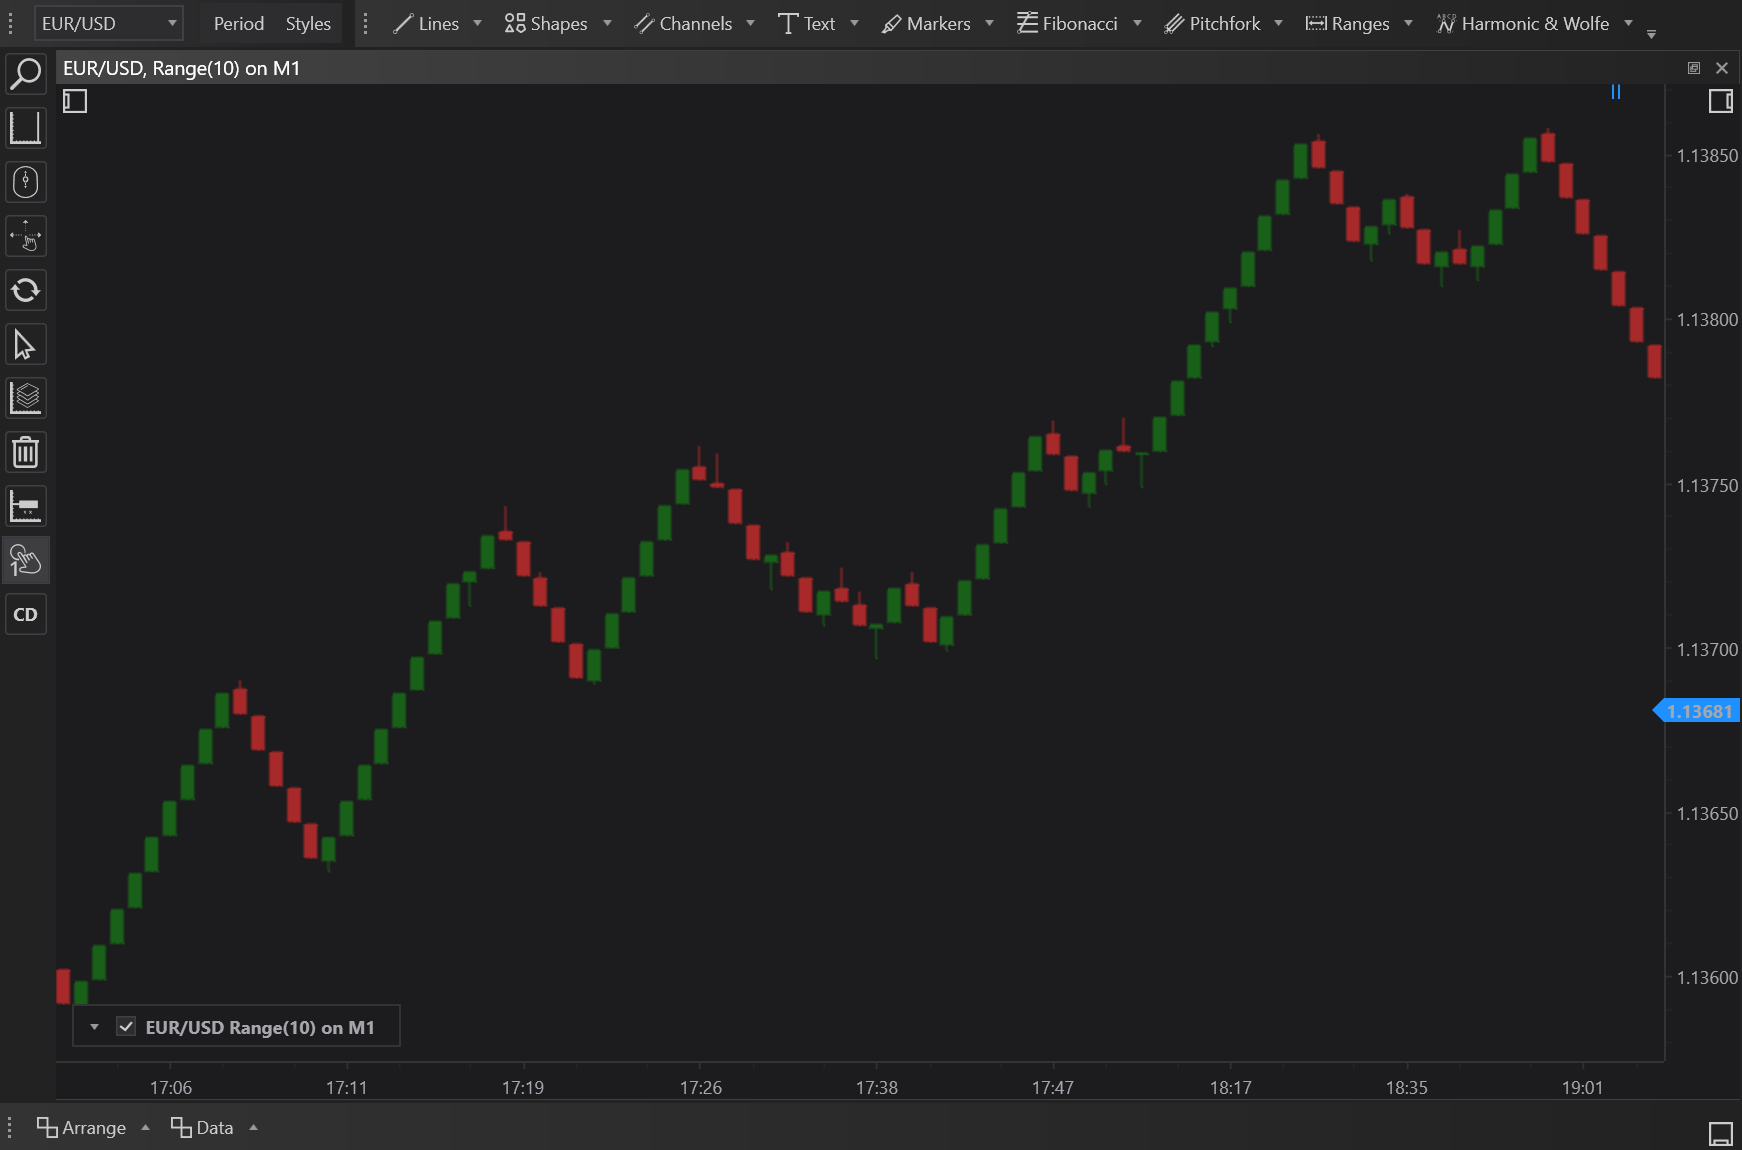
Range charts are constructed by plotting the high and low price of an asset over a certain period of time. The chart is then divided into price ranges, which are represented by boxes. Each box represents a certain price range, and the color of the box indicates whether the asset's price has increased or decreased during that period. If the price of the asset has increased, the box is usually plotted in green, and if it has decreased, it is plotted in red.
Range charts can be customized based on the trader's preference. For example, some traders prefer to use a fixed range chart, where the size of the boxes is determined by the trader and remains constant throughout the chart. Others prefer to use a dynamic range chart, where the size of the boxes is determined by the market and can change over time.
How Range Charts are Constructed and Built
Range charts are constructed using software or a charting platform. To build a range chart, the trader needs to input the data for the asset they are interested in, such as the high and low price for a certain period of time. The charting software or platform will then construct the range chart based on the input data.
Range charts can be constructed using various timeframes, including daily, weekly, or monthly. The trader can also choose to construct the chart using a specific number of price bars, such as 10, 20, or 50. The choice of time frame and number of bars will depend on the trader's trading strategy and the asset they are trading.
How Range Charts are Used
Range charts are used by traders to track the price movement of an asset and identify potential trading opportunities. The main advantage of range charts is that they simplify the trading analysis process by focusing solely on the price action. This can be useful for traders who are looking to eliminate noise and distractions from their analysis.
Range charts can be used in various ways, depending on the trader's preference and trading strategy. For example, some traders use range charts to identify key support and resistance levels, while others use them to confirm a trend or reversal.
Examples of Trading with Range Charts
Traders can use range charts in various ways, depending on their trading strategy. Here are some examples of how traders use range charts:
Identifying Key Support and Resistance Levels: Range charts can be used to identify key support and resistance levels, which are critical levels that the price of an asset is likely to bounce off of. By identifying these levels, traders can make more informed trading decisions and increase their chances of success.
Confirming Trends and Reversals: Range charts can be used to confirm trends and reversals in the market. For example, if the price of an asset is consistently making higher highs and higher lows, this is an indication of an uptrend. On the other hand, if the price of an asset is making lower lows and lower highs, this is an indication of a downtrend. Range charts can also be used to identify potential trend reversals, which can occur when the price of an asset breaks through key support or resistance levels.
Identifying Breakouts: Range charts can be used to identify potential breakouts, which occur when the price of an asset moves outside of its established range. For example, if the price of an asset has been trading within a certain range for a period of time, and then suddenly breaks out of that range, this can be an indication of a potential trading opportunity.
Determining Market Sentiment: Range charts can also be used to determine market sentiment. For example, if the boxes on the chart are mostly green, this can be an indication that the market is bullish, while if the boxes are mostly red, this can be an indication that the market is bearish.
Pros and Cons of Trading with Range Charts
Like any other type of trading tool or chart, range charts have both positive and negative aspects. Here are some of the most important ones:
Pros of Trading with Range Charts:
-
Simplified Trading Analysis: Range charts simplify the trading analysis process by focusing solely on the price action. This makes it easier for traders to identify key support and resistance levels, trends, and reversals in the market.
-
Removal of Time Element: Range charts do not take into account the time element, making them a popular choice for traders who want to eliminate noise and distractions from their analysis.
-
Customization: Range charts can be customized based on the trader's preference, including the choice of time frame and the size of the boxes.
-
Easy to Read: Range charts are easy to read and interpret, which makes them a great choice for both beginner and experienced traders.
Cons of Trading with Range Charts:
-
Lack of Time Element: While the removal of the time element can simplify the analysis process, it can also be a drawback for some traders. The time element can provide valuable information about the market and the price movement, which is not available with range charts.
-
Limited Information: Range charts only provide limited information about the market and the price movement, as they only focus on the high and low price for a certain period of time.
-
Lack of Volume Information: Range charts do not provide any information about the volume of an asset, which can be critical for some traders.
-
Not Suitable for Scalping: Range charts are not suitable for scalping, as they do not provide information about the short-term price movement of an asset. Scalpers require more detailed and up-to-date information about the market, which is not available with range charts.
In conclusion, range charts can be a useful tool for traders who want to simplify their trading analysis and focus on the price action. However, they are not suitable for all trading strategies and may not provide enough information for some traders. It's important for traders to consider their trading style and goals before deciding to use range charts in their analysis.