Renko charts are a popular technical analysis tool used by traders in the financial markets. These charts, which are also known as "brick charts," are named after the Japanese word "renga," which means "brick." Renko charts were developed in Japan and have been used in the country's financial markets for centuries. However, they have gained increasing popularity in other parts of the world in recent years. In this article, we will delve into the history, principles, and usage of Renko charts, as well as explore their pros and cons.
History and Origins of Renko Charts
Renko charts have a long history in Japan's financial markets, where they have been used for centuries. The exact origins of Renko charts are not clear, but it is believed that they were first developed by Japanese rice traders as a way to track price movements in the rice market.
Renko charts were later introduced to the Western world by Steve Nison, who is credited with popularizing Japanese candlestick charts in the 1980s. Nison learned about Renko charts while studying the financial markets in Japan and wrote about them in his book "Japanese Candlestick Charting Techniques."
Basic Principles of Renko Charts
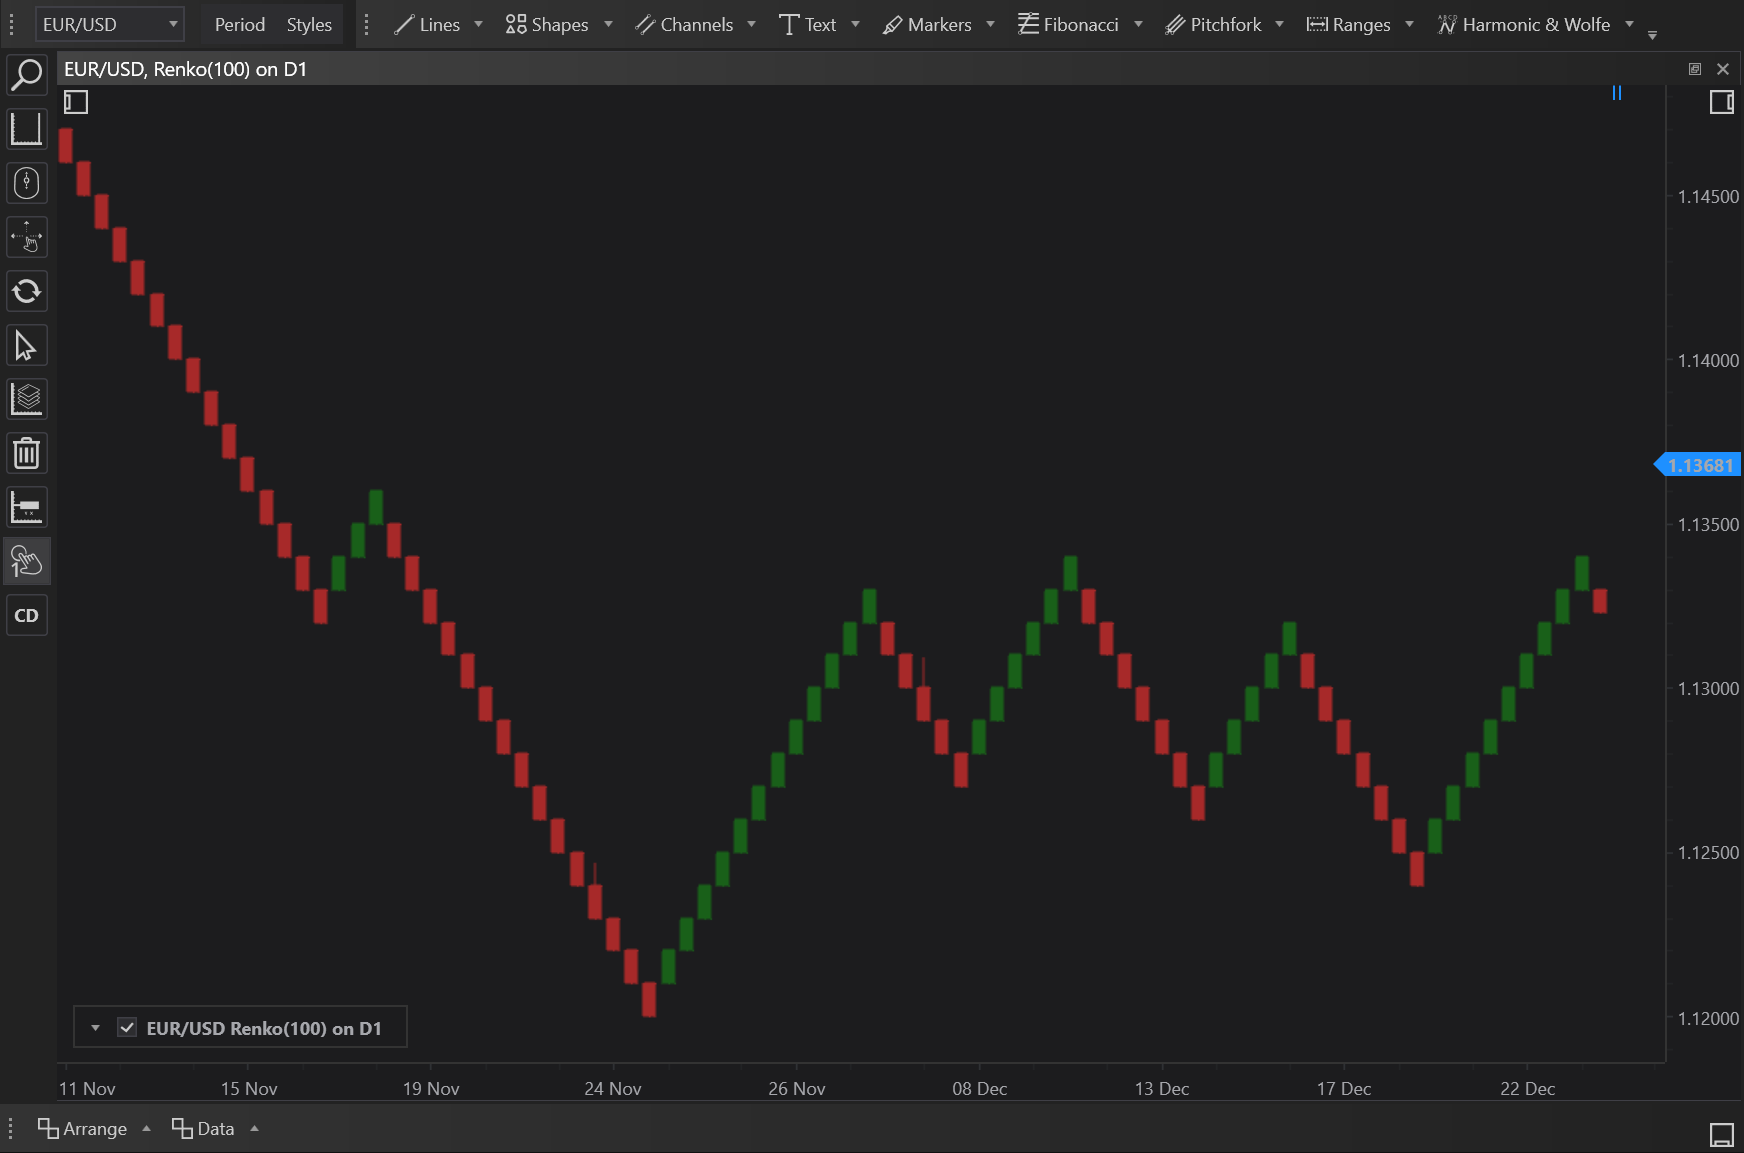
Renko charts are constructed by plotting bricks, or boxes, on a chart. These bricks are added to the chart based on the price action of the security, rather than on the passage of time. This means that Renko charts do not take into account the time element, making them distinct from other types of charts, such as candlestick charts or bar charts.
Renko charts are based on the concept of "true price movement," which means that only significant price movements are plotted on the chart. This is achieved by setting a minimum price movement, or "brick size," which determines the size of the bricks on the chart. For example, if the brick size is set to $1, a new brick will be added to the chart only if the price moves $1 or more.
Construction and Building of Renko Charts
To construct a Renko chart, the following steps must be followed:
-
Choose a security: The first step in constructing a Renko chart is to choose the security that you want to track. This can be a stock, currency, commodity, or any other financial instrument.
-
Set the brick size: The next step is to set the brick size, which determines the minimum price movement required to add a new brick to the chart.
-
Determine the direction of the trend: Once the brick size is set, the direction of the trend can be determined by comparing the current price to the previous brick. If the current price is higher than the previous brick, it indicates an uptrend, and a white brick is added to the chart. If the current price is lower than the previous brick, it indicates a downtrend, and a black brick is added to the chart.
-
Add bricks to the chart: As the price of the security moves, bricks are added to the chart based on the direction of the trend and the brick size. If the price moves up by the brick size or more, a white brick is added to the chart. If the price moves down by the brick size or more, a black brick is added to the chart.
Usage of Renko Charts
Renko charts are used by traders to identify trends and make informed trading decisions. These charts are particularly useful for identifying trends in volatile or choppy markets, as they filter out noise and focus on the underlying trend.
Traders can use Renko charts in a variety of ways, including:
- Identifying trends: Renko charts make it easy to identify the trend of a security, as the direction of the bricks provides a clear indication of the trend. If the bricks are predominantly white, it indicates an uptrend, while predominantly black bricks indicate a downtrend.
-
Identifying support and resistance levels: Renko charts can be used to identify key levels of support and resistance, which can be useful for setting stop-loss orders and taking profit.
-
Identifying trend reversals: Renko charts can also be used to identify potential trend reversals, as the direction of the bricks can change rapidly when the trend changes.
Examples of Trading Using Renko Charts
Here are a few examples of how traders might use Renko charts in their trading:
-
A trader might use Renko charts to identify an uptrend in a security and then place a long trade when a white brick appears on the chart.
-
A trader might use Renko charts to identify a downtrend in a security and then place a short trade when a black brick appears on the chart.
-
A trader might use Renko charts to identify key levels of support and resistance and then place trades based on these levels.
Pros and Cons of Trading with Renko Charts
Like any technical analysis tool, Renko charts have both advantages and disadvantages. Here are some of the pros and cons of trading with these charts:
Pros:
-
Renko charts provide a clear picture of the underlying trend, making it easier to identify trade opportunities.
-
These charts filter out noise and focus on the underlying trend, providing a clearer view of the market.
-
Renko charts are simple and easy to understand, making them suitable for traders of all levels of experience.
Cons:
-
Renko charts may not be suitable for shorter-term trading, as they tend to lag behind the price action.
-
These charts can produce false signals in choppy or range-bound markets.
-
Renko charts may not be as widely accepted or understood as other technical analysis tools, such as regular candlestick charts.
In conclusion, Renko charts are a useful tool for traders looking to identify trends and make informed trading decisions. While these charts have their limitations, they can be a valuable addition to a trader's toolkit when used correctly.