Volume Charts: An Essential Tool for Analyzing Market Activity
Volume charts are a specialized type of chart used in financial markets to focus specifically on trading volume rather than price changes over time. These charts provide a unique perspective on market activity, offering insights that are not visible through traditional price-based charts. This article will explore the construction, principles, usage, and unique advantages of volume charts, along with some considerations for their application in trading strategies.
History and Origins of Volume Charts
Unlike traditional charting methods that originated from old trading practices, volume charts have been developed more recently, driven by the need to understand the dynamics of trading volume in relation to price action. Volume plays a crucial role in confirming the strength of price movements, and volume charts were designed to give traders clearer insights into buying and selling pressure.
Basic Principles of Volume Charts
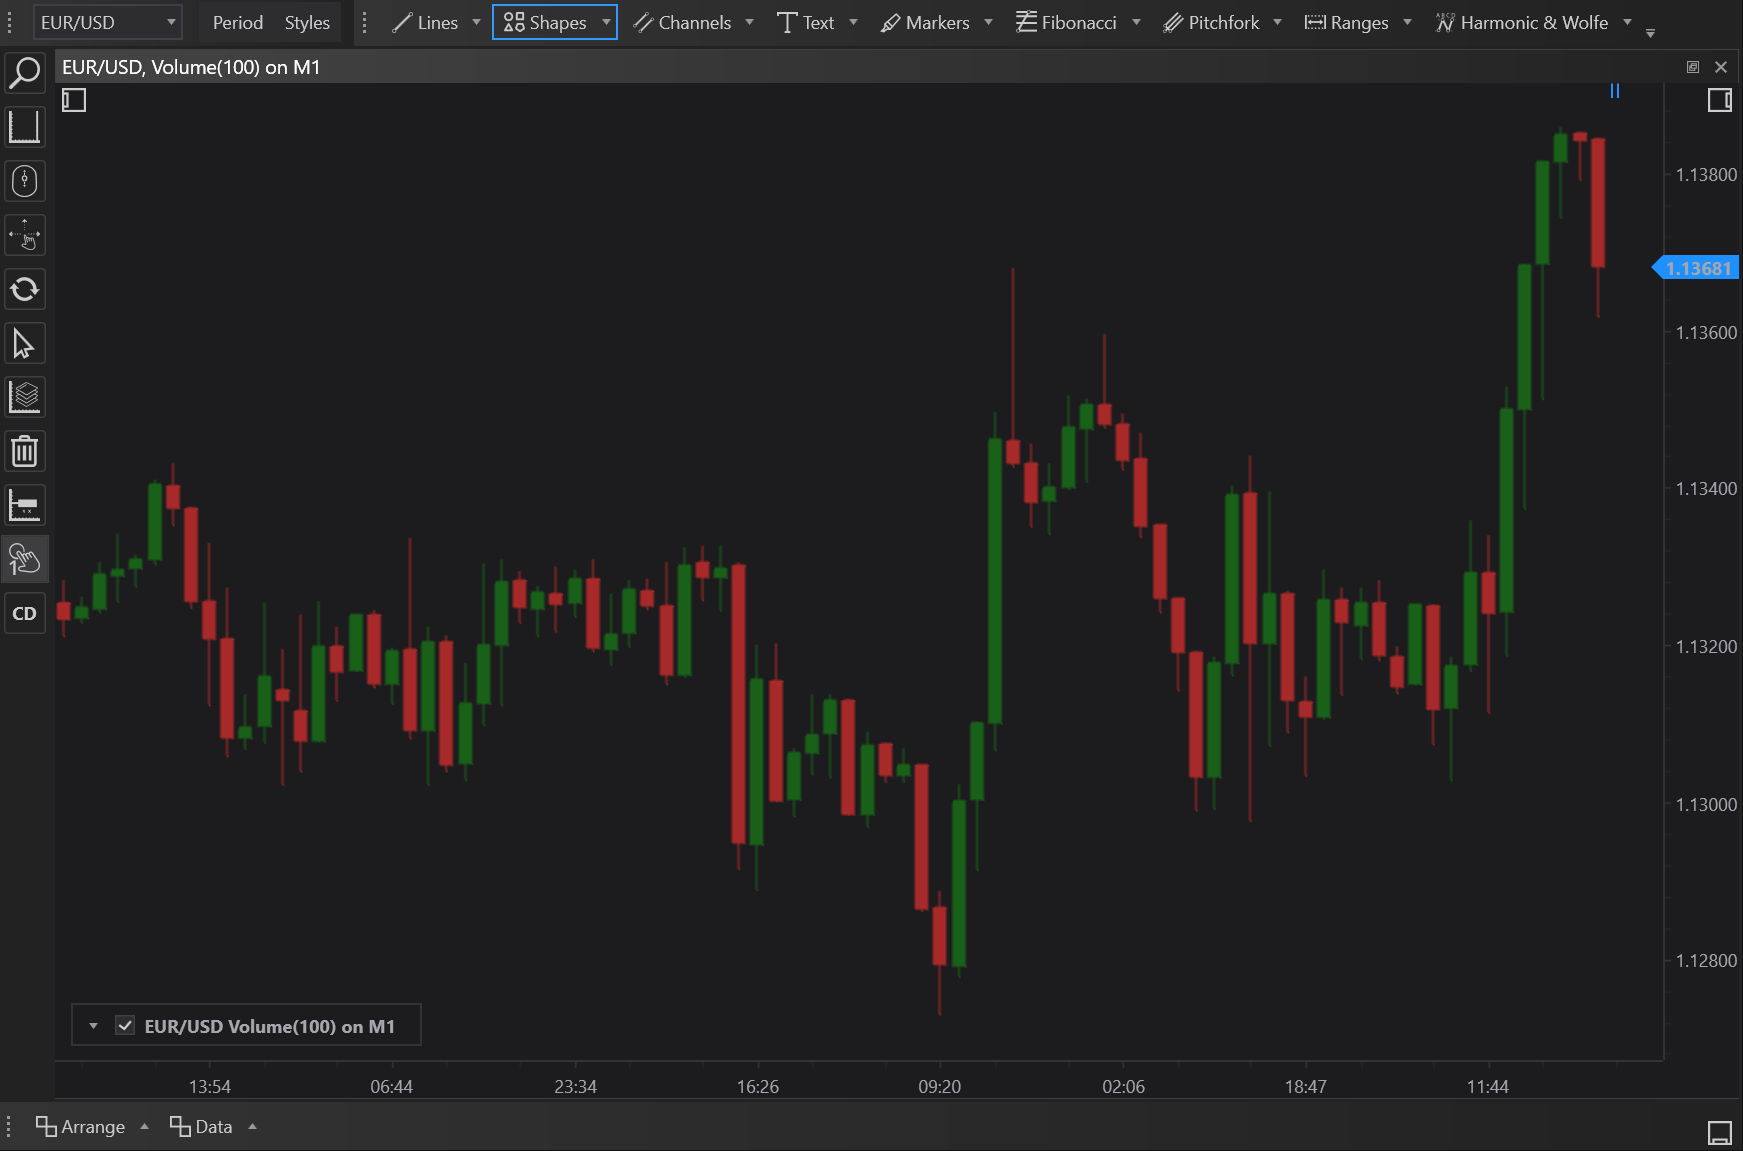
Volume charts are constructed by plotting bars or candlesticks that each represent a set amount of traded volume. Each bar on a volume chart consolidates trading data until a specified volume threshold is reached, then a new bar is started, regardless of the time it takes to reach this volume.
Key Features:
- Volume-Driven Bars: Each bar or candlestick is formed based on a predetermined volume size. For example, a 1,000-volume chart will form a new bar every time 1,000 units of the asset have been traded.
- Focus on Market Activity: These charts shift the focus from time intervals to market activity, highlighting periods of high or low trading activity regardless of the time it takes.
Construction and Building of Volume Charts
To construct a volume chart, follow these steps:
- Select the Volume Size: Determine the fixed volume that will trigger the formation of a new bar. This might be based on typical trading volumes observed during specific market conditions.
- Collect Trade Data: As trades occur, aggregate the volume until the predetermined threshold is reached.
- Plot the Bar: Once the volume threshold is met, plot the bar with the opening, high, low, and closing prices for that volume segment.
- Repeat the Process: Start the next bar's volume accumulation immediately after the previous bar is completed.
Usage of Volume Charts
Volume charts are particularly useful for traders who focus on volume analysis as a primary indicator of market sentiment. They can be employed in several ways:
- Trend Confirmation: By observing volume patterns, traders can confirm if a price movement is backed by substantial trading volume, suggesting a stronger likelihood of trend continuation.
- Breakout Identification: High volume bars following a consolidation period may indicate a breakout.
- Reducing Noise: By focusing solely on volume, these charts help to filter out the 'noise' in markets that occurs with low volume and insignificant price changes.
Pros and Cons of Trading with Volume Charts
Pros:
- Clarity in Analysis: Volume charts provide a clear view of market activity, making it easier to identify meaningful movements.
- Focus on Significant Data: These charts help traders focus on significant trading activity, which is often more relevant for making trading decisions.
Cons:
- Loss of Time Context: Volume charts do not provide information about the time taken for volume accumulation, which can be a drawback for strategies dependent on timing.
- Complex Volume Patterns: Without traditional volume overlays, traders may need to adjust their strategies to interpret volume information differently.
Conclusion
Volume charts offer a powerful alternative to traditional time-based charting by focusing on the integral aspect of trading volume. They allow traders to see through the market noise and focus on periods where significant trading activity occurs, providing clearer signals for trading decisions. While they require a shift in how traders interpret volume data, their benefits in clarity and focus can significantly enhance trading strategies in fast-moving markets.