Bar (OHLC) Charts: Precision and Clarity in Price Movements
Bar (OHLC) charts stand as a fundamental analysis tool in the financial markets, offering traders a clear depiction of price actions including open, high, low, and close values within a given period. This article will delve into the history, principles, and the various styles of Bar (OHLC) charts provided in FinStudio, emphasizing their function and advantages for traders.
History and Origins of Bar (OHLC) Charts
Bar (OHLC) charts are among the oldest types of financial charts used by traders to observe price movements over time. While their exact origins are not as culturally specific as candlestick charts, they have been a standard tool in Western technical analysis for many decades, serving as a primary method for displaying price data in the stock markets and later, in digital trading platforms.
Basic Principles of Bar (OHLC) Charts
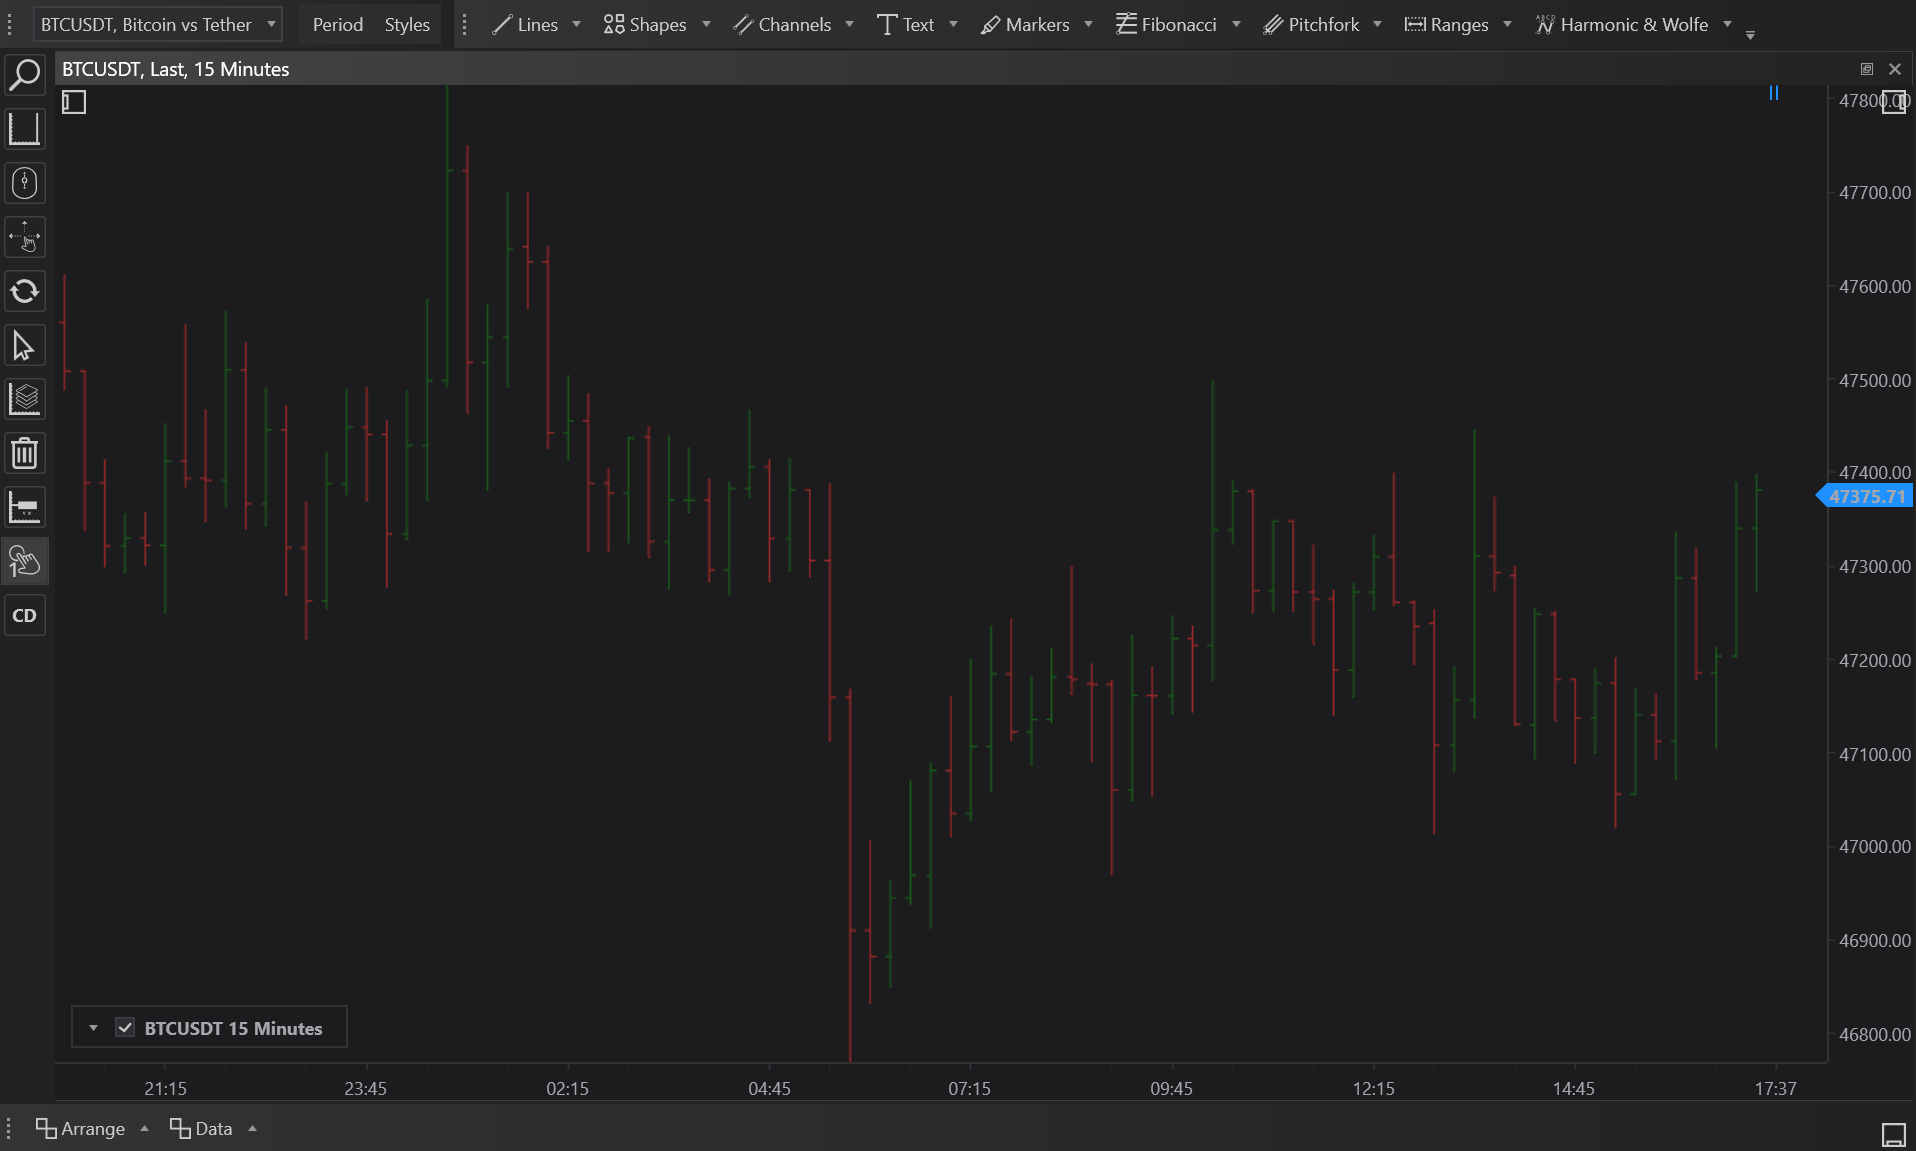
Bar charts represent price activity through a vertical line and two horizontal ticks. The vertical line illustrates the range between the highest and lowest traded prices during the session, while the ticks indicate the opening (left tick) and closing (right tick) prices.
- Vertical Line: Displays the full range of trading (high to low).
- Left Tick: Marks the opening price.
- Right Tick: Marks the closing price.
Types of Bar (OHLC) Charts in FinStudio
FinStudio provides several variations of the traditional Bar chart to cater to different trading strategies and data visualization needs:
- Filled (Body line and wicks):
- This style enhances the traditional bar chart by filling in the body between the open and close prices, making it visually easier to discern the direction of the price movement within the trading period.
- Hide Open Wick:
- Focuses only on the closing price dynamics by hiding the open tick, simplifying analysis especially when the opening price is less relevant to the trader’s strategy.
- Hide Close Wick:
- Removes the close tick to emphasize the opening and the high-low range, useful for strategies that focus on how prices start during a trading period versus how they settle.
- Bar in Middle of Text (Text Visible in Cluster Chart Mode):
- Integrates the bar chart within textual data centrally, facilitating the correlation of numerical data with its descriptive analysis.
- Bar on Left from Text (Text Visible in Cluster Chart Mode):
- Aligns the bar chart to the left side of the textual data, aiding in a structured layout for simultaneous visual and textual data analysis.
Usage of Bar (OHLC) Charts
Bar charts are utilized extensively across various market conditions to provide a concise yet comprehensive view of market movements:
- Trend Analysis: The visual distinction between open and close prices along with the high-low range offers clear signals of market trends and potential reversals.
- Comparative Analysis: Traders often use bar charts to compare the price actions of multiple periods or sessions to gauge market volatility and stability.
Applications and Benefits
- Clarity and Precision: Provides clear insights into market dynamics without the visual complexity of candlestick shadows.
- Flexibility: Adaptable to various trading styles and analysis techniques, whether focusing on intraday movements or long-term trends.
Pros and Cons
Pros:
- Ease of Interpretation: New and experienced traders alike find bar charts easy to understand due to their straightforward presentation.
- Detailed Market Insights: Offers a detailed view of the market's opening, closing, highs, and lows.
Cons:
- Less Visual Appeal: Some traders may find bar charts less visually compelling than more graphical presentations like candlesticks.
- Requires Context: Like all technical tools, bar charts are most effective when used in conjunction with other indicators and analytical methods.
Conclusion
Bar (OHLC) charts are an indispensable tool in the arsenal of financial market analysis, providing essential insights into price behavior with precision and clarity. By utilizing the various styles available in FinStudio, traders can tailor their analysis to better understand market dynamics and make informed trading decisions based on comprehensive price data.