Candlestick Charts: A Comprehensive Guide
History and Origins of Candlestick Charts
The creation of candlestick charts is widely attributed to a legendary Japanese rice trader named Munehisa Homma in the 18th century. Homma developed these charts to track and predict price movements in the rice markets of Osaka. The concept was later popularized in the Western world by Steve Nison, an American author who introduced candlestick charting to Western traders through his seminal book, "Japanese Candlestick Charting Techniques," in the 1990s.
Basic Principles of Candlestick Charts
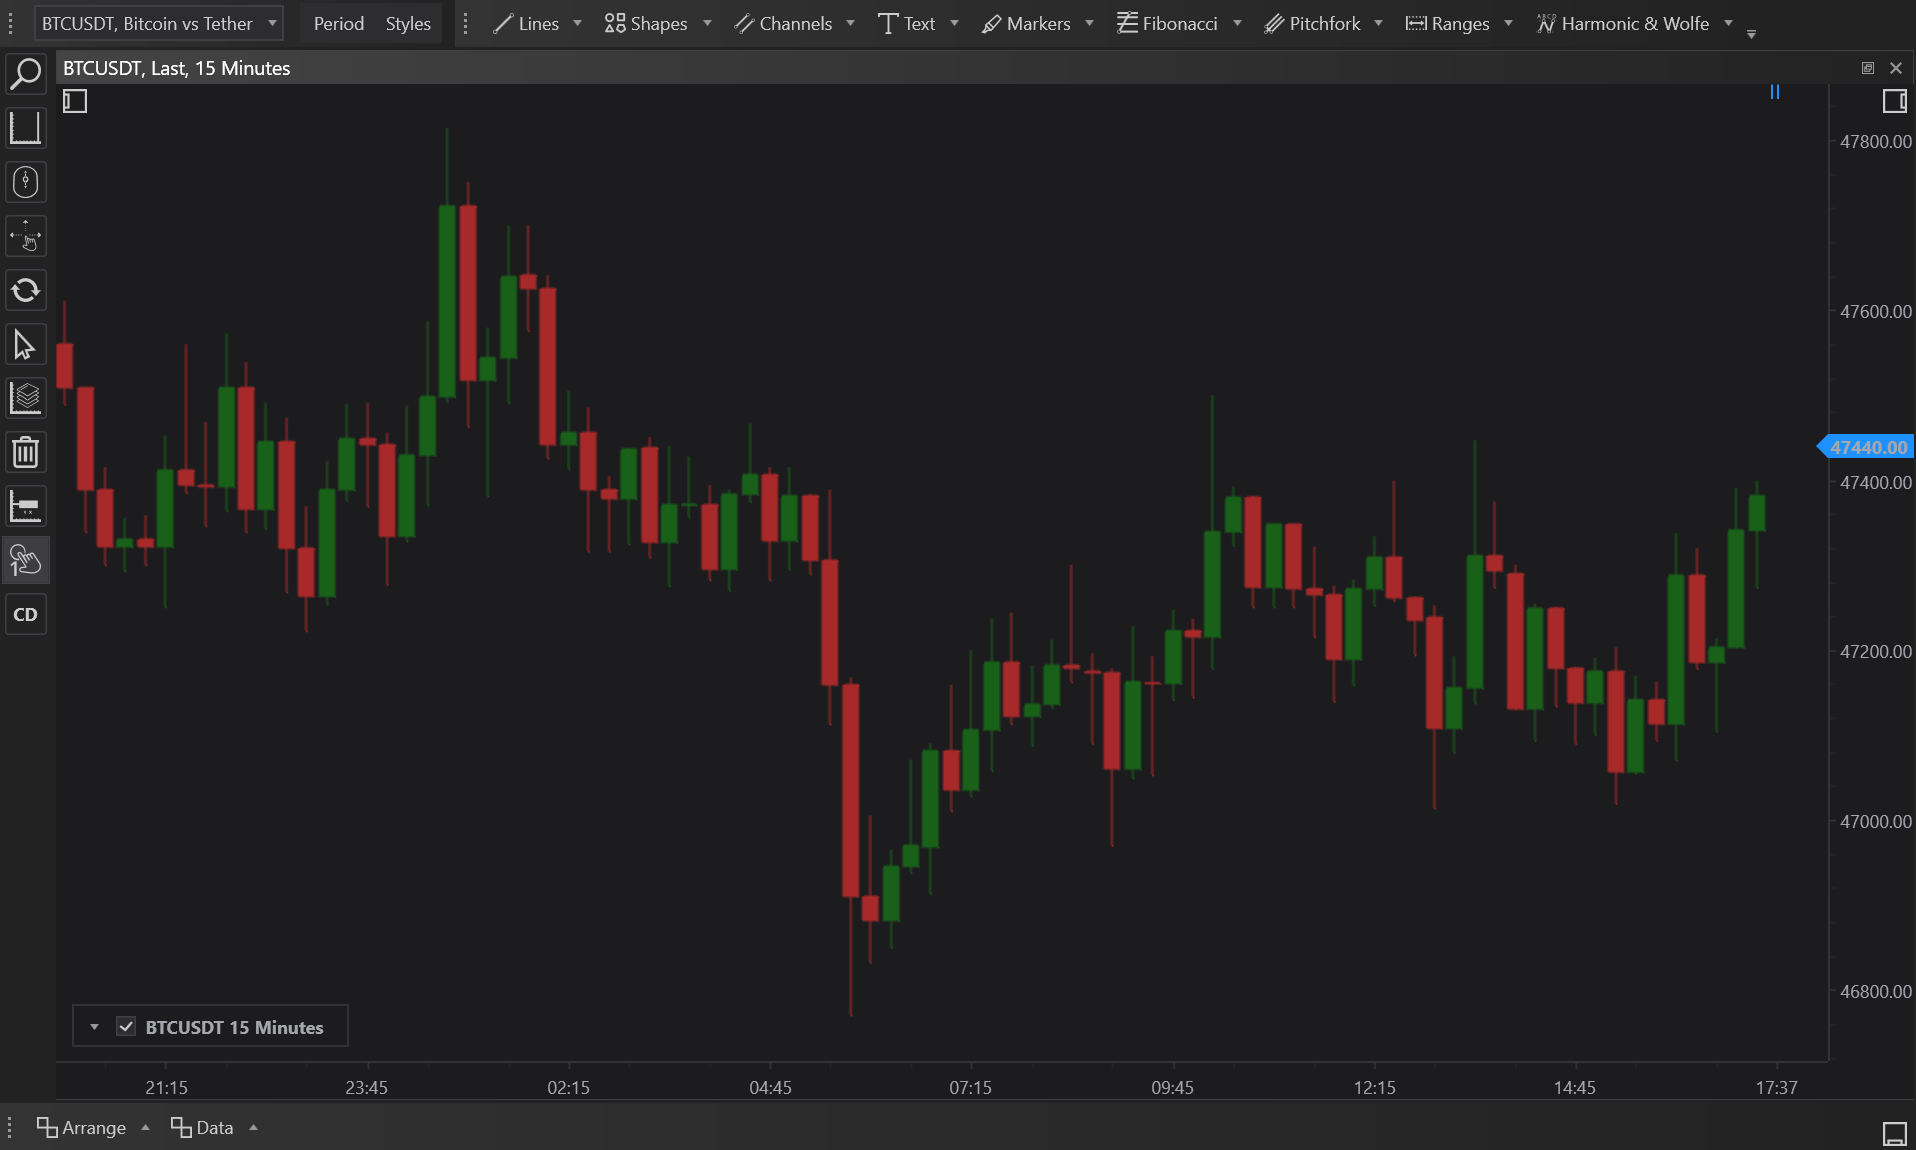
Candlestick charts are distinctive for their "candles" — each representing price movement within a given timeframe. Each candlestick displays four crucial pieces of information: the opening price, the closing price, the highest price, and the lowest price during the period.
- Body: The wide part of the candlestick, called the body, shows the range between the opening and the closing prices. A filled or colored body signifies a closing price lower than the opening price, indicating a bearish period. Conversely, an empty or lighter body indicates a closing price higher than the opening price, suggesting a bullish period.
- Wicks/Shadows: The lines protruding from the body represent the high and low prices during the period and are sometimes called shadows or wicks. The high is marked by the top of the upper shadow, while the low is marked by the bottom of the lower shadow.
Bullish vs Bearish Candle
- Bullish Candle: When the close is above the open, indicating buying pressure.
- Bearish Candle: When the close is below the open, indicating selling pressure.
Construction and Use of Candlestick Charts
To construct a candlestick chart, traders follow these steps:
- Select a Time Frame: Determine the time frame for each candlestick (e.g., 1 minute, 1 hour, 1 day).
- Plot the Candles: For each period, draw a candle by noting the open, high, low, and close prices.
- Color the Candles: Color the candles based on whether the close was higher or lower than the open.
Types of Candlestick Charts in FinStudio
FinStudio enhances traditional candlestick charting with several customizable styles, catering to various trading strategies and preferences:
-
Full (Candle Body and Wicks):
- Includes both the body and wicks of the candlestick, providing a complete view of all price action during the period.
-
Body (Only Filled Candle Body Without Wicks):
- Focuses solely on the open and close prices by displaying only the candle body. This style simplifies the chart, making it easier to see periods of opening and closing price movements without the distraction of price spikes.
-
Wicks and Border (Without Body Fill, Text Visible in Cluster Chart Mode):
- Shows only the wicks and borders of the candlesticks without filling the body, offering a clear view of the highs and lows. The lack of body fill can reduce visual clutter, making this style suitable for analyzing volatility while reading cluster chart data.
-
Candle in Middle of Text (Text Visible in Cluster Chart Mode):
- Positions the candlestick in the middle of associated textual data, aiding in the integration of numerical data analysis with visual price trends.
-
Candle on Left from Text (Text Visible in Cluster Chart Mode):
- Aligns the candlestick to the left of any textual annotations, facilitating an orderly presentation of data where narrative context or supplementary information accompanies the visual.
Usage of Candlestick Charts
Candlestick charts are highly valued for their ability to provide a quick visual insight into market sentiment and potential price movements, which is critical for making trading decisions. They are particularly useful for:
- Trend Identification: The direction of the candles can help identify the market's trend. Multiple bullish candles may indicate an uptrend, while multiple bearish candles might suggest a downtrend.
- Pattern Recognition: Candlestick patterns, such as dojis, hammers, engulfing patterns, and shooting stars, can signal reversals or continuation of trends.
- Price Action Analysis: Traders use candlesticks to make decisions based on how prices are behaving, which can be more telling than numerical data alone.
Examples of Trading Using Candlestick Charts
Here are some practical examples of how traders use candlestick charts:
- Bullish Engulfing Pattern: A trader might spot a bullish engulfing pattern at a support level and decide to enter a long position, anticipating a potential upward reversal.
- Bearish Shooting Star: Recognition of a shooting star pattern near a resistance level could prompt a trader to take a short position, expecting a price decline.
Pros and Cons of Trading with Candlestick Charts
Pros:
- Visual Appeal: Candlesticks provide an easy-to-interpret visual representation of market dynamics.
- Detailed Information: They offer more information than traditional bar charts or line charts, including sentiment and potential reversals.
- Widely Used: Candlestick patterns are well-recognized and integrated into many trading strategies and software.
Cons:
- Subjectivity: Interpreting candlestick patterns can sometimes be subjective and may lead to different conclusions by different traders.
- Need for Context: Candlestick patterns are more effective when combined with other forms of analysis, such as technical indicators or fundamental analysis.
- Potential Information Overload: The wealth of information in candlestick charts can sometimes be overwhelming for new traders.
Conclusion
Candlestick charts are an invaluable tool for traders looking to enhance their understanding of market conditions. With their detailed visualization of price movements, these charts provide key insights that help traders make informed decisions based on prevailing market sentiment and trends. While they come with their own set of challenges, the benefits of using candlestick charts in trading are undeniable, making them a cornerstone of technical analysis in financial markets.