Cluster charts, commonly known as Footprint charts in the trading community, offer a granular view of market activity by displaying detailed information about traded volumes at specific price levels within a given time frame. These charts are invaluable for traders who need to understand market depth and the balance between supply and demand. This article will delve into the functionality, principles, and strategic use of Cluster charts in FinStudio, highlighting their benefits and applications.
Overview of Cluster Charts
Cluster charts provide a more intricate look at market dynamics compared to traditional charting methods by mapping out the volume of trades at distinct price points. This type of chart helps traders see not just where price has moved but where it has hesitated or encountered significant activity, offering insights into the intent and conviction behind price movements.
Key Features of Cluster Charts
- Volume Visualization: Each cell in the chart represents the volume traded at a specific price level during a particular time interval.
- Price vs. Volume Correlation: These charts display how volume is distributed relative to price changes, highlighting potential support and resistance levels based on actual trading activity.
- Bid/Ask Imbalance: By showing the disparity between buying and selling volumes, traders can gauge the strength of market participants.
How Cluster Charts Work in FinStudio
Cluster charts in FinStudio are designed to offer deep insights into trading activity:
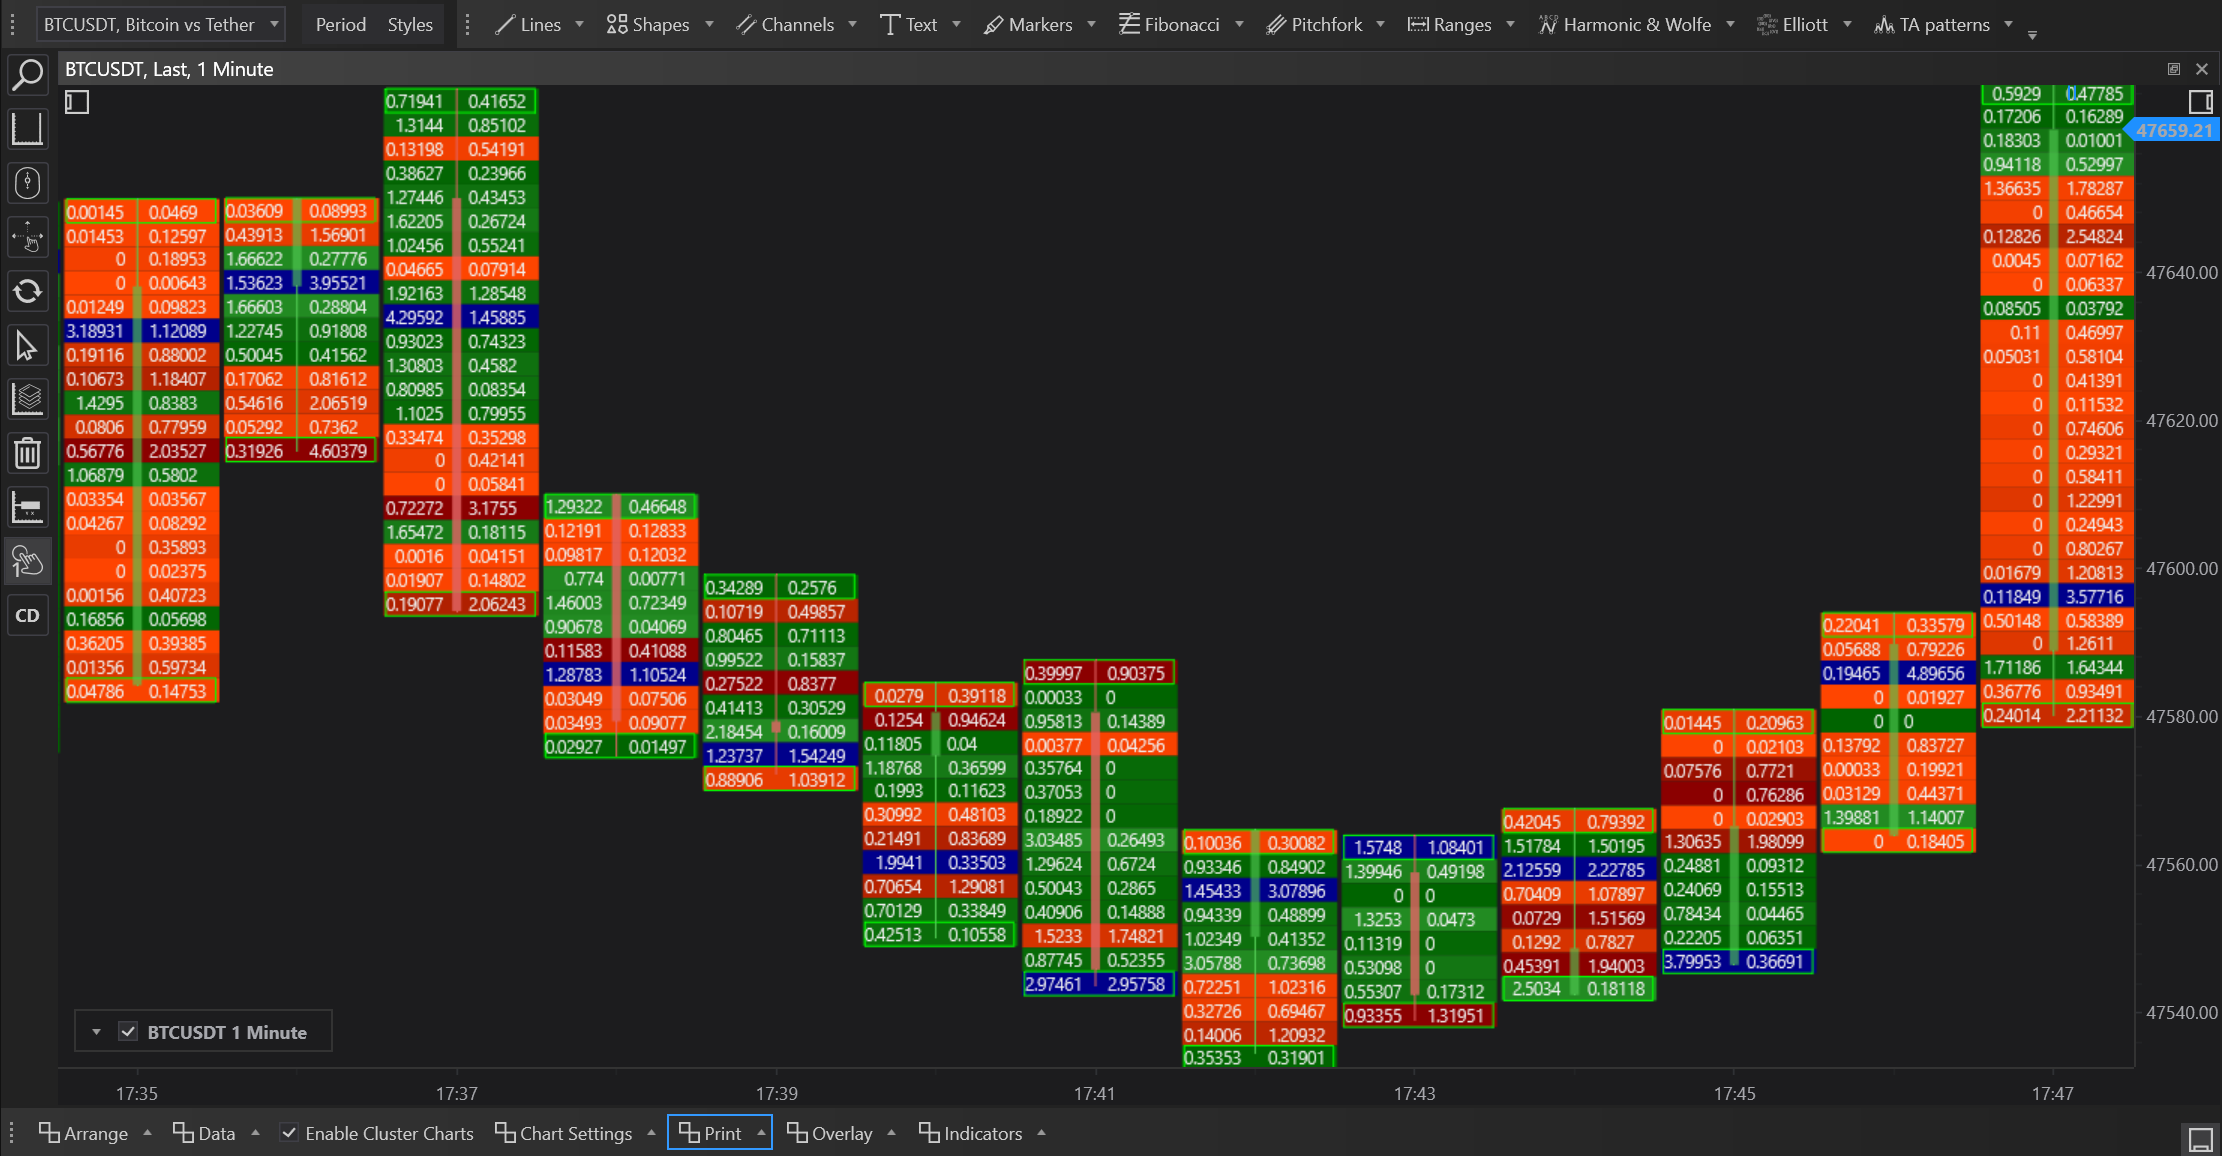
- Data Organization: The chart organizes data into columns that represent time intervals and rows that correspond to price levels. Each cell within the grid shows the volume traded at that price during the specified time.
- Color Coding: Different colors or shading intensities indicate higher or lower volumes, making it easier to spot where the majority of trading activity occurred.
- Bid/Ask Data: Advanced versions of these charts can also show separate volumes for bids and asks, further detailing the market's buying and selling pressures.
Applications and Benefits
- Market Sentiment Analysis: Cluster charts help identify whether buyers or sellers are dominating the market at specific price levels.
- Identification of Key Levels: High-volume nodes can indicate important price levels where significant trades have taken place, serving as potential support or resistance in future sessions.
- Trade Execution and Management: By observing where large volumes are transacted, traders can better position their entries and exits, potentially improving the execution of their trades.
Practical Examples of Using Cluster Charts
- Spotting Accumulation and Distribution: Areas with exceptionally high volume may indicate accumulation (if prices rise) or distribution (if prices fall) phases.
- Identifying Breakouts: A sudden increase in volume at new price levels can signal a breakout where traders might look to enter new positions or adjust stops.
Advantages
- Depth of Information: Provides a detailed view of trading activity at each price level, which is not available in traditional line or bar charts.
- Strategic Decision Making: Helps in making informed trading decisions based on where significant volumes are traded and potential price movements.
Limitations
- Complexity: The amount of information and the format can be overwhelming for new traders.
- Resource Intensive: Requires significant data processing, which might demand more from trading systems in terms of performance.
Conclusion
Cluster charts in FinStudio offer a sophisticated tool for traders aiming to enhance their market analysis capabilities. By providing a detailed view of trading activity at each price point, these charts allow for a deeper understanding of market dynamics and help refine trading strategies based on volume analysis. While they may pose a challenge in terms of complexity and data handling, the strategic advantages they offer can be substantial for those willing to master their use. As with any analytical tool, the effectiveness of Cluster charts improves when used in conjunction with other indicators and market analysis techniques.