Cluster Chart Settings
FinStudio's Cluster Charts offer a range of customizable settings that enable traders to tailor the charts according to their specific needs. These settings are designed to enhance the utility of the cluster charts by allowing for precise control over how data is displayed.
Here's a breakdown of the available chart settings and their practical applications:
Chart Settings Overview
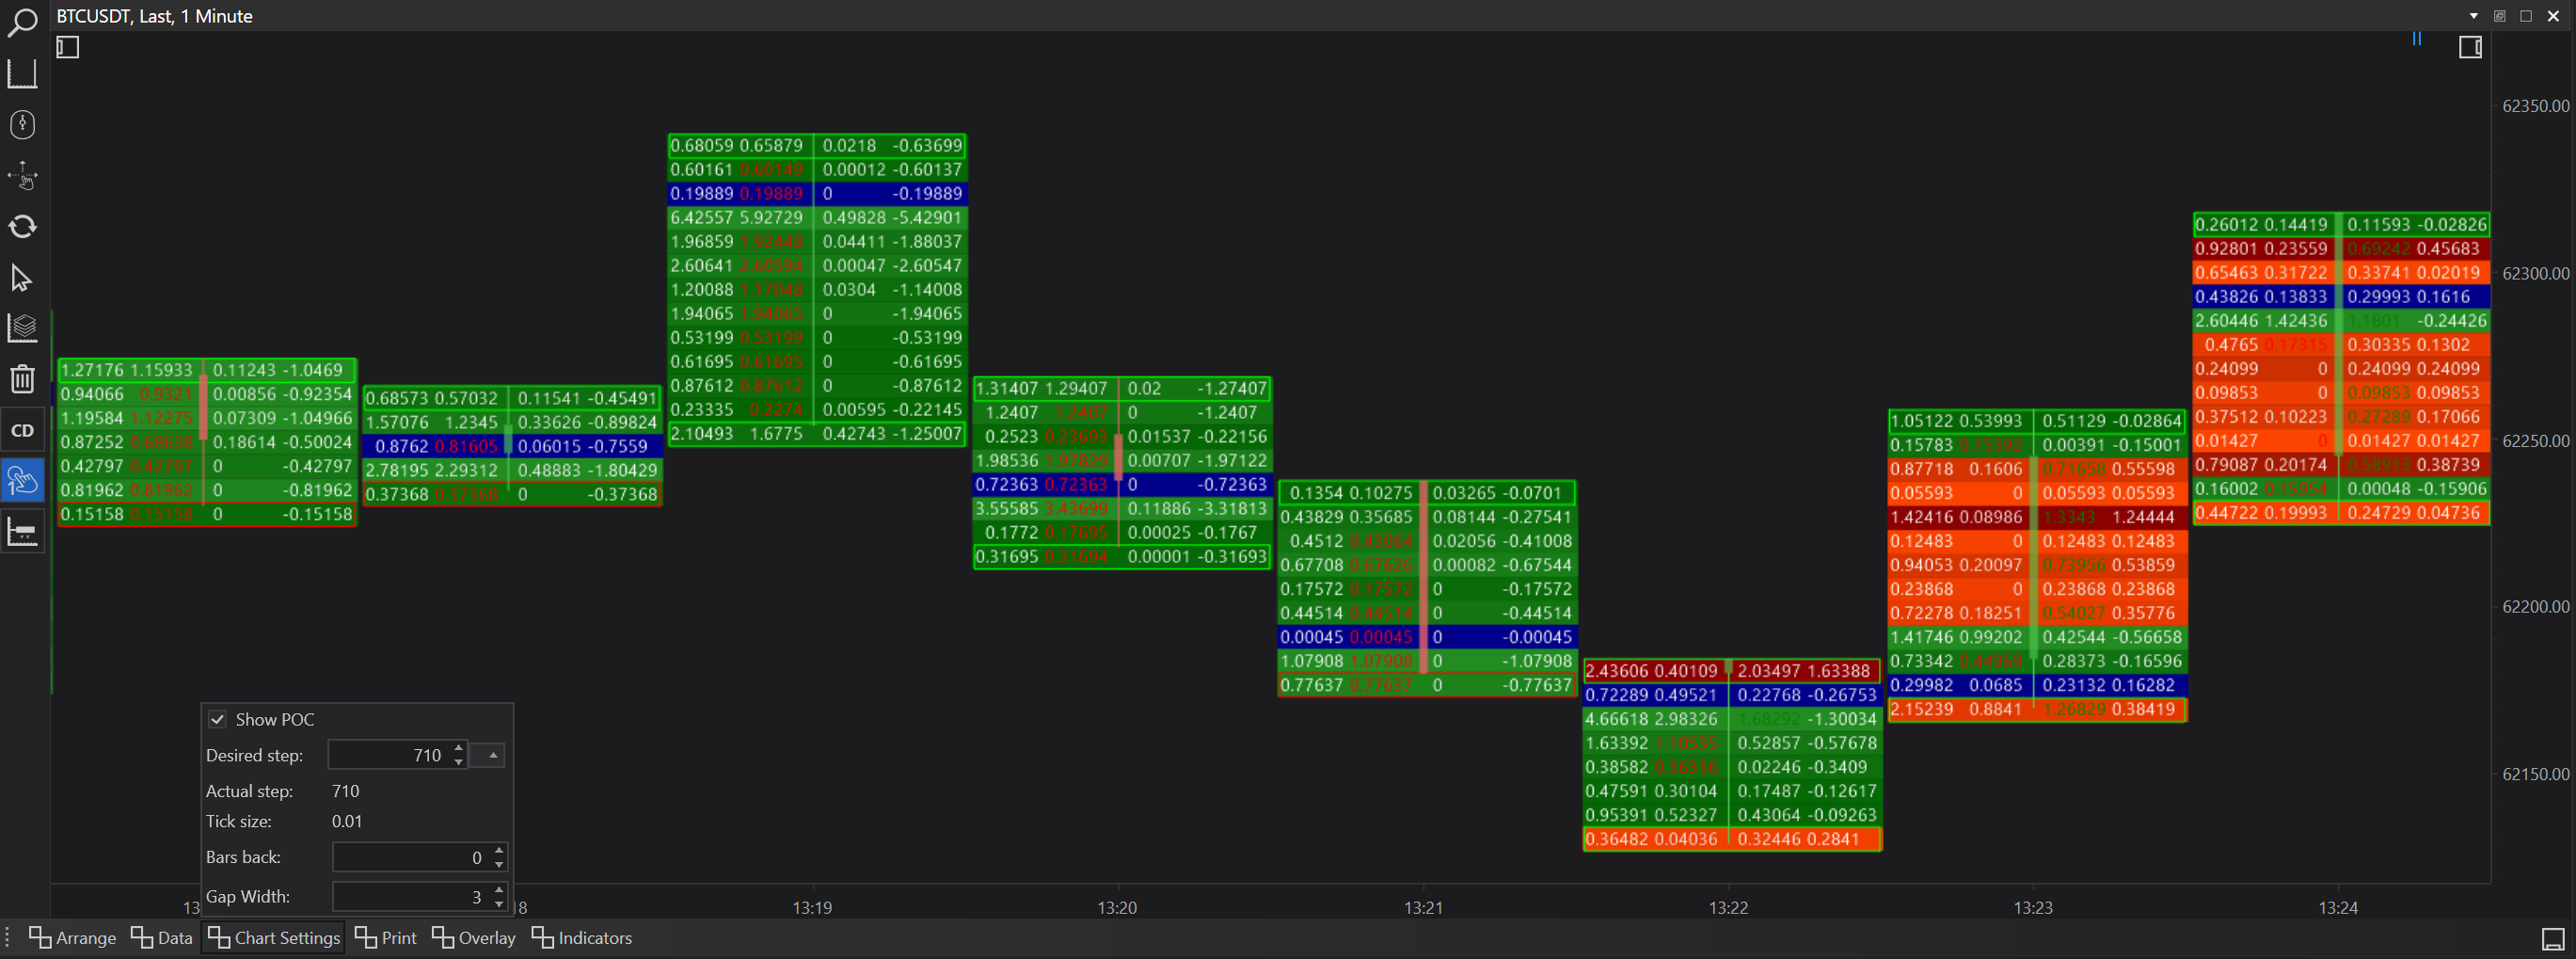
Show POC (Point of Control)
Option: Checkbox
Description: Toggles the visibility of the Point of Control, which is the price level at which the highest volume was traded over the analyzed period.
Use Case: Essential for identifying the price level with the most trading activity, often acting as a strong support or resistance level.
Desired Step
Option: Input field
Description: Allows users to specify the desired price step for clustering data. This determines the granularity of price levels shown in the cluster.
Use Case: Adjusting this setting helps in refining the chart to show more detailed levels or broader levels depending on analysis needs.
Actual Step
Description: Displays the actual step used, which may differ from the 'Desired Step' due to rounding or other factors.
Use Case: Provides clarity on the exact step interval being used, ensuring that traders understand the granularity of the data presented.
Tick Size
Description: The minimum fluctuation in price for the instrument being analyzed.
Use Case: Important for setting other parameters accurately, ensuring that the step size aligns with the tick size of the instrument.
Bars Back
Option: Adjustable input field
Default: 0 (calculated for all available data)
Description: Defines how many bars back the chart calculations should extend. A setting of 0 means that the chart considers all available data.
Use Case: Useful for focusing the analysis on a specific number of recent bars, helping traders concentrate on more relevant data for short-term decision-making.
Gap Width
Option: Adjustable input field
Default: 3
Description: Sets the width of the gap between two cluster chart candles. This affects the visual spacing on the chart.
Use Case: Adjusting the gap width can improve chart readability, especially when analyzing complex patterns across multiple clusters.
Leveraging Chart Settings Effectively
-
Personalization: These settings provide flexibility, allowing traders to personalize cluster charts based on their trading style and the specific characteristics of the market they are analyzing.
-
Strategic Analysis: By tweaking these settings, traders can adapt the charts to better fit the analysis of different time frames and volatility levels. For example, reducing the 'Bars Back' during periods of high market activity can provide a clearer view of recent trends.
-
Visualization: Proper adjustment of settings like 'Gap Width' and 'Show POC' can significantly enhance the visual effectiveness of cluster charts, making it easier to identify key market movements and patterns.
Conclusion
The customizable settings in FinStudio’s Cluster Charts are powerful tools that offer traders enhanced control over their technical analysis. By understanding and effectively utilizing these settings, traders can optimize their view of market dynamics, leading to more informed trading decisions and potentially improved trading outcomes. Whether adjusting for visual clarity or aligning the chart with specific analytical requirements, these settings contribute significantly to the versatility and effectiveness of Cluster Charts in FinStudio.