Cluster Chart Indicators
FinStudio's Cluster Charts not only provide detailed visual representations of trading activity but also support the integration of various indicators that enrich the analysis further. These indicators are presented in separate panels beneath the main chart, each offering unique insights into market dynamics. Here’s a detailed look at each indicator available in FinStudio's Cluster Charts:
Available Indicators
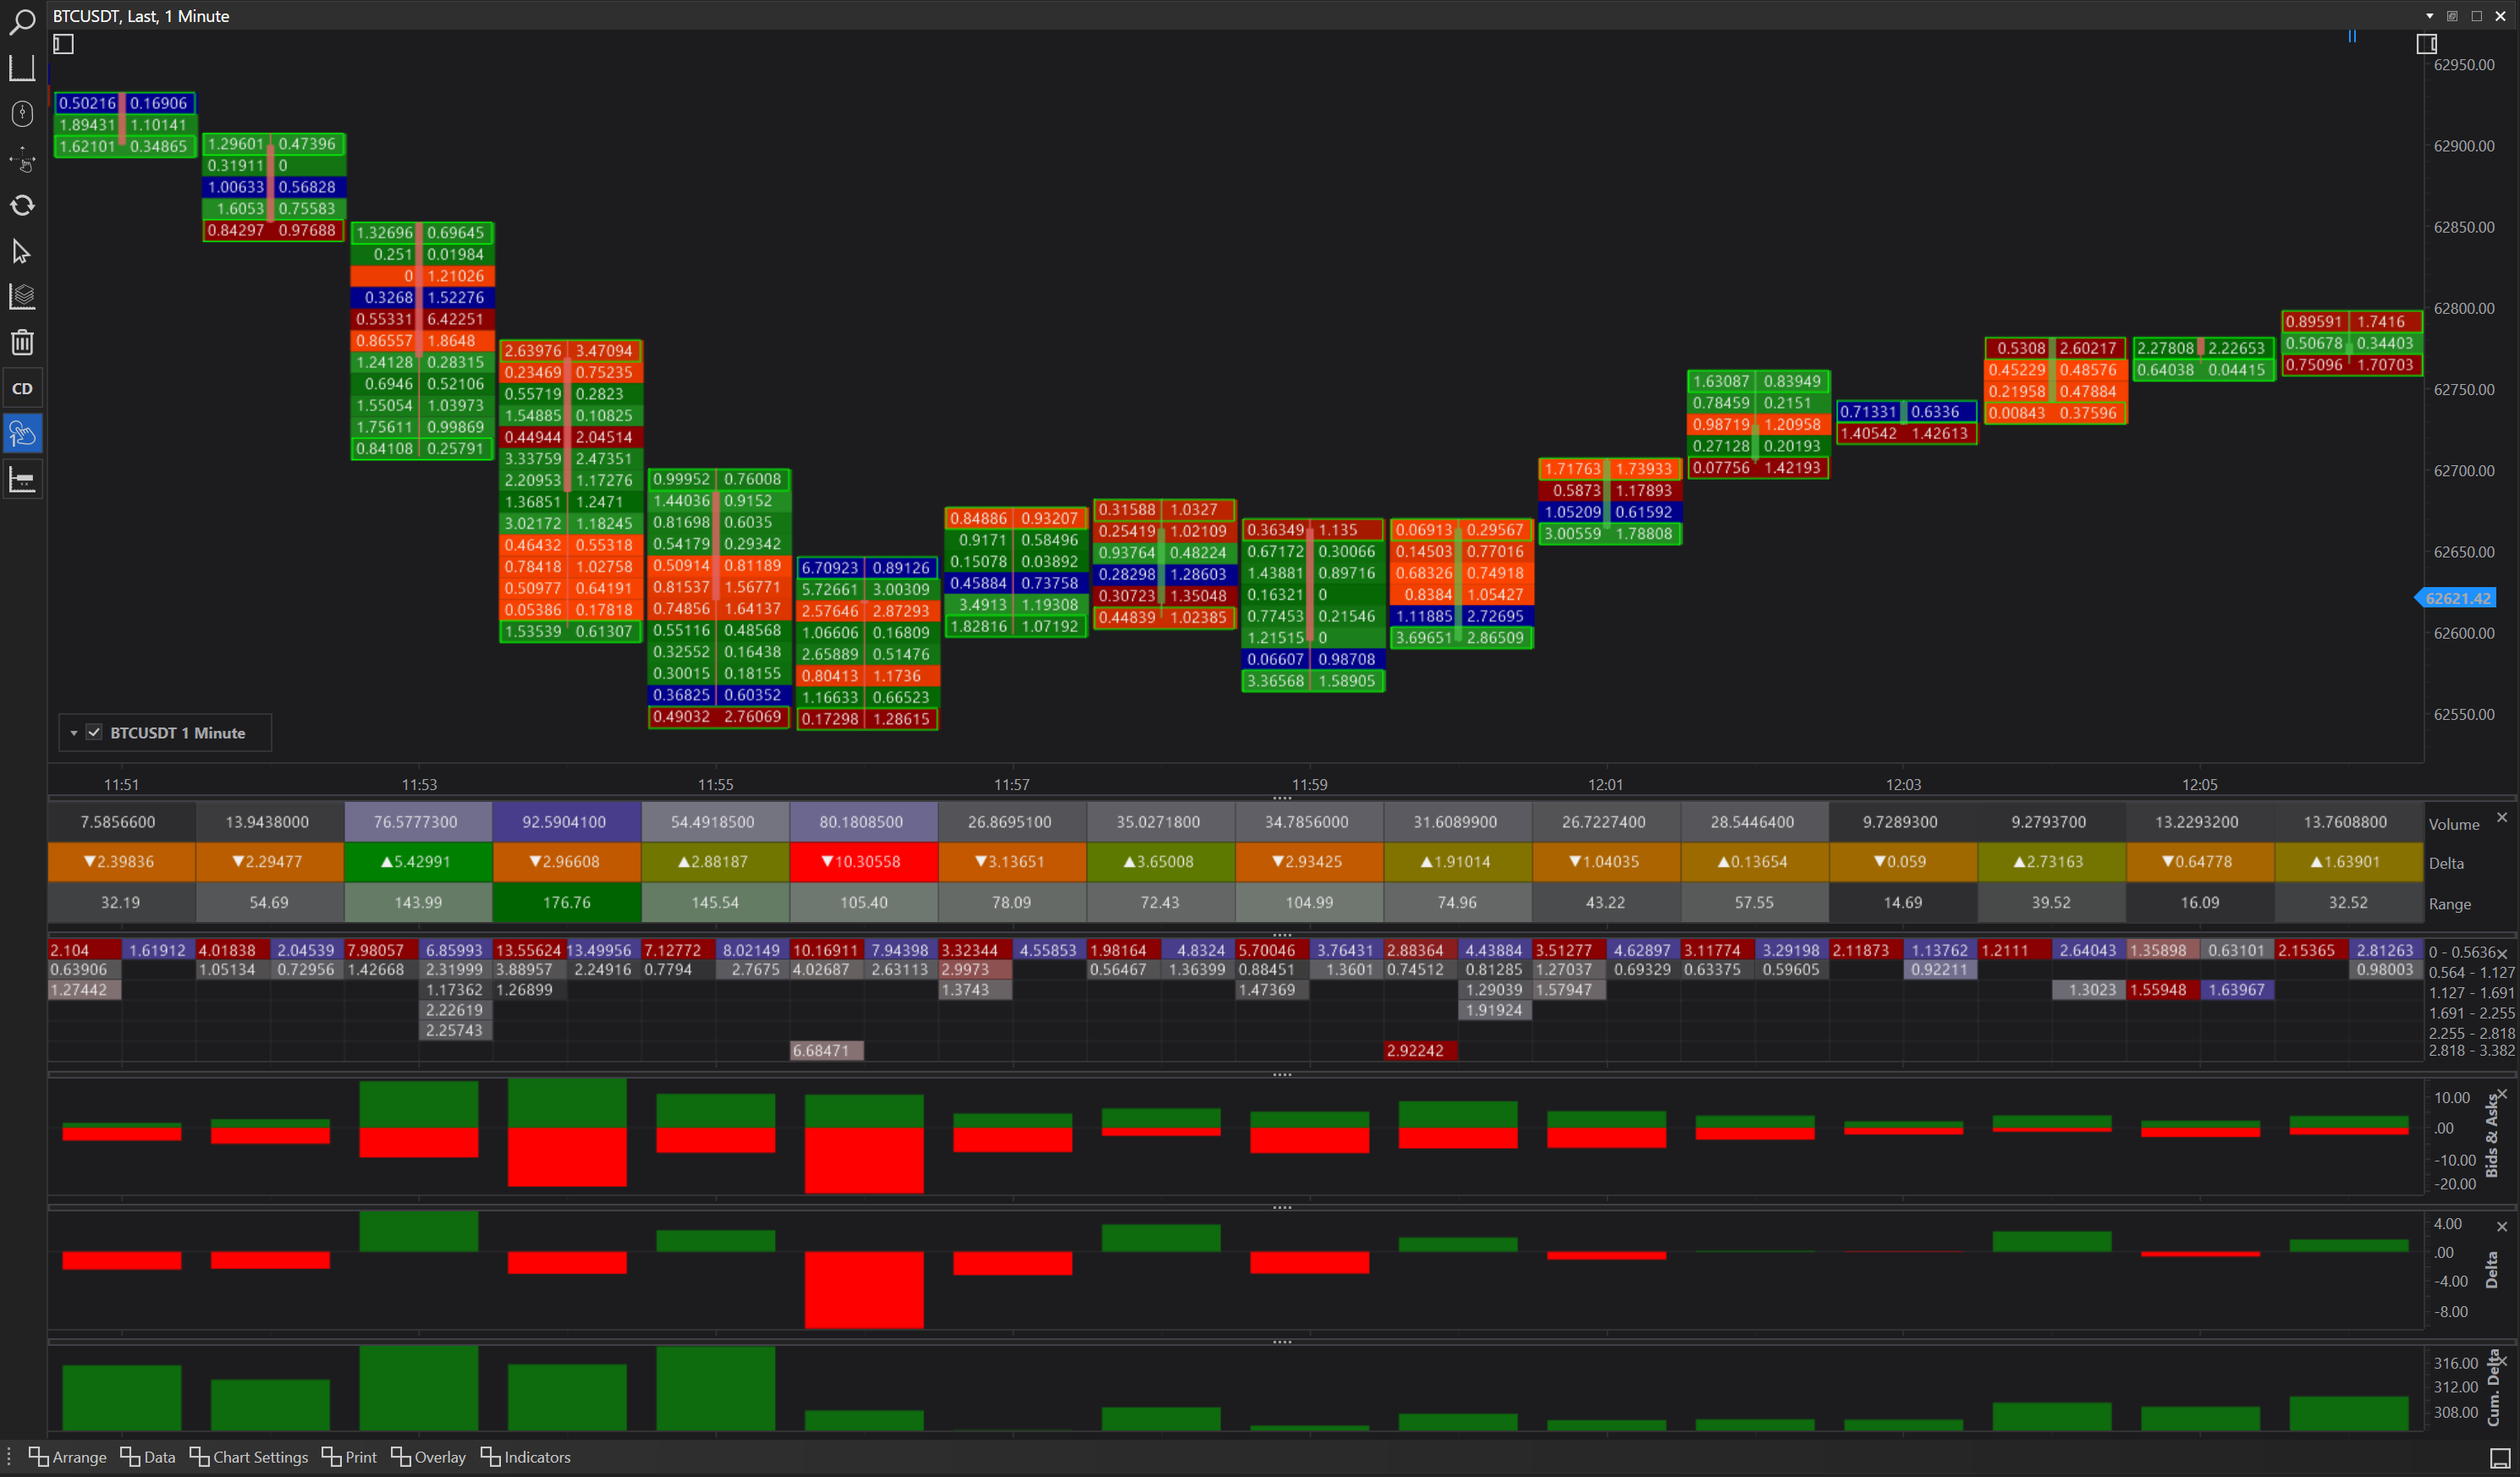
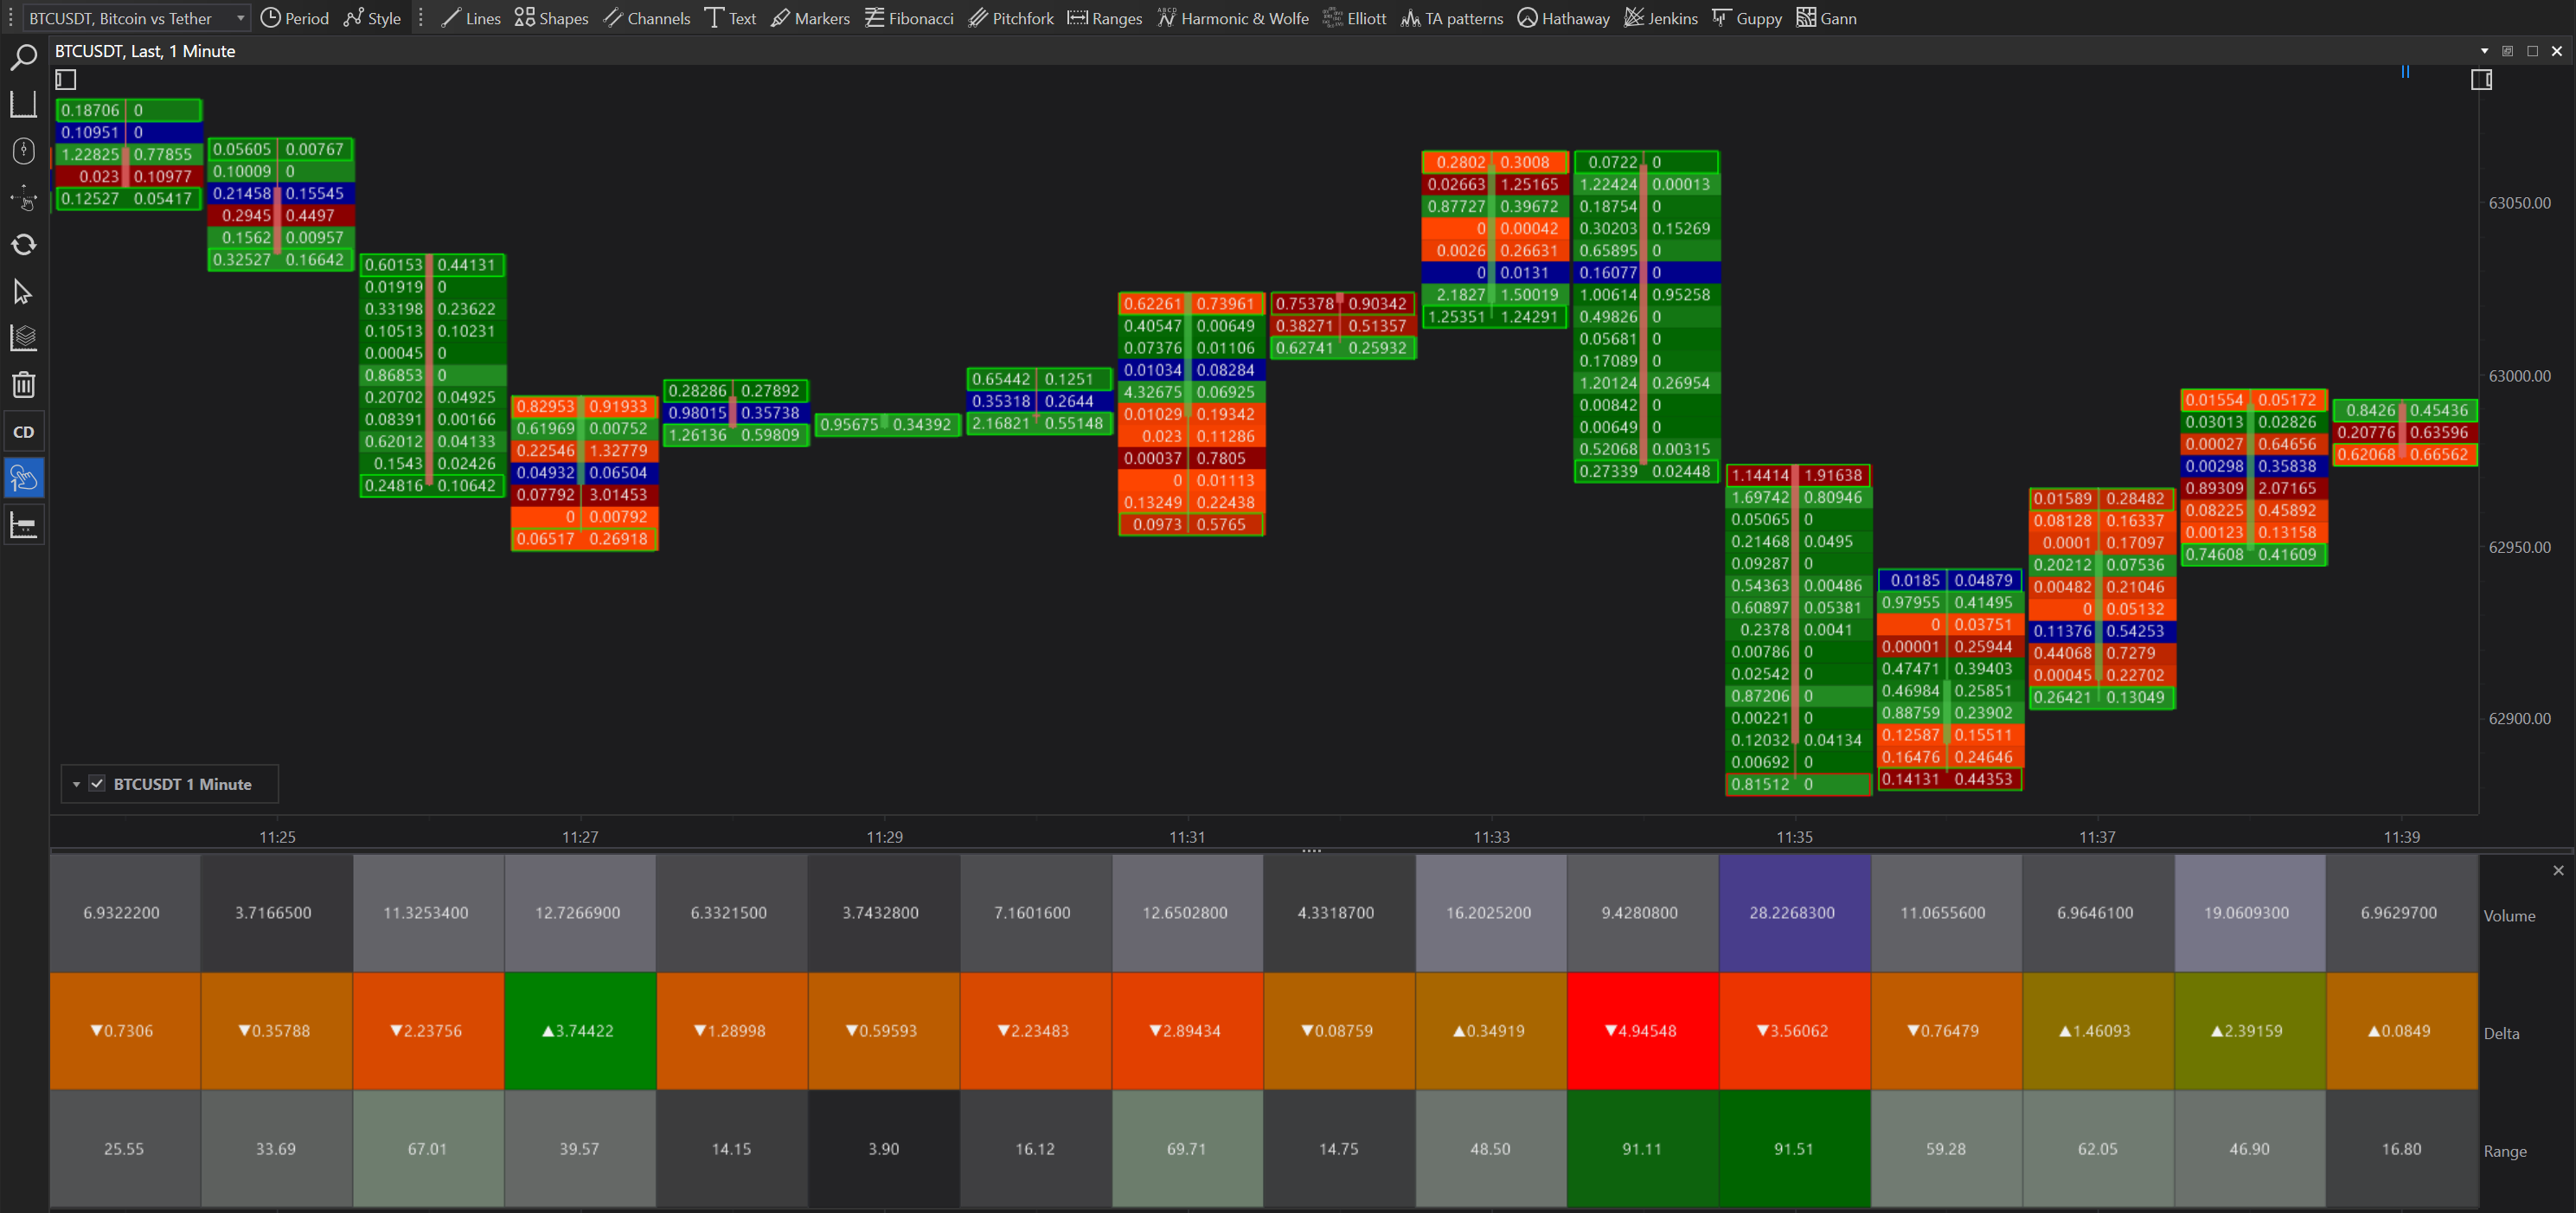
Bar Statistics
Description: Provides statistical data for each bar, including volume, open, close, high, and low prices, as well as cumulative figures like average price.
Utility: This indicator is crucial for quick assessments of bar-level data, helping traders understand the weight of trading activity within each bar.
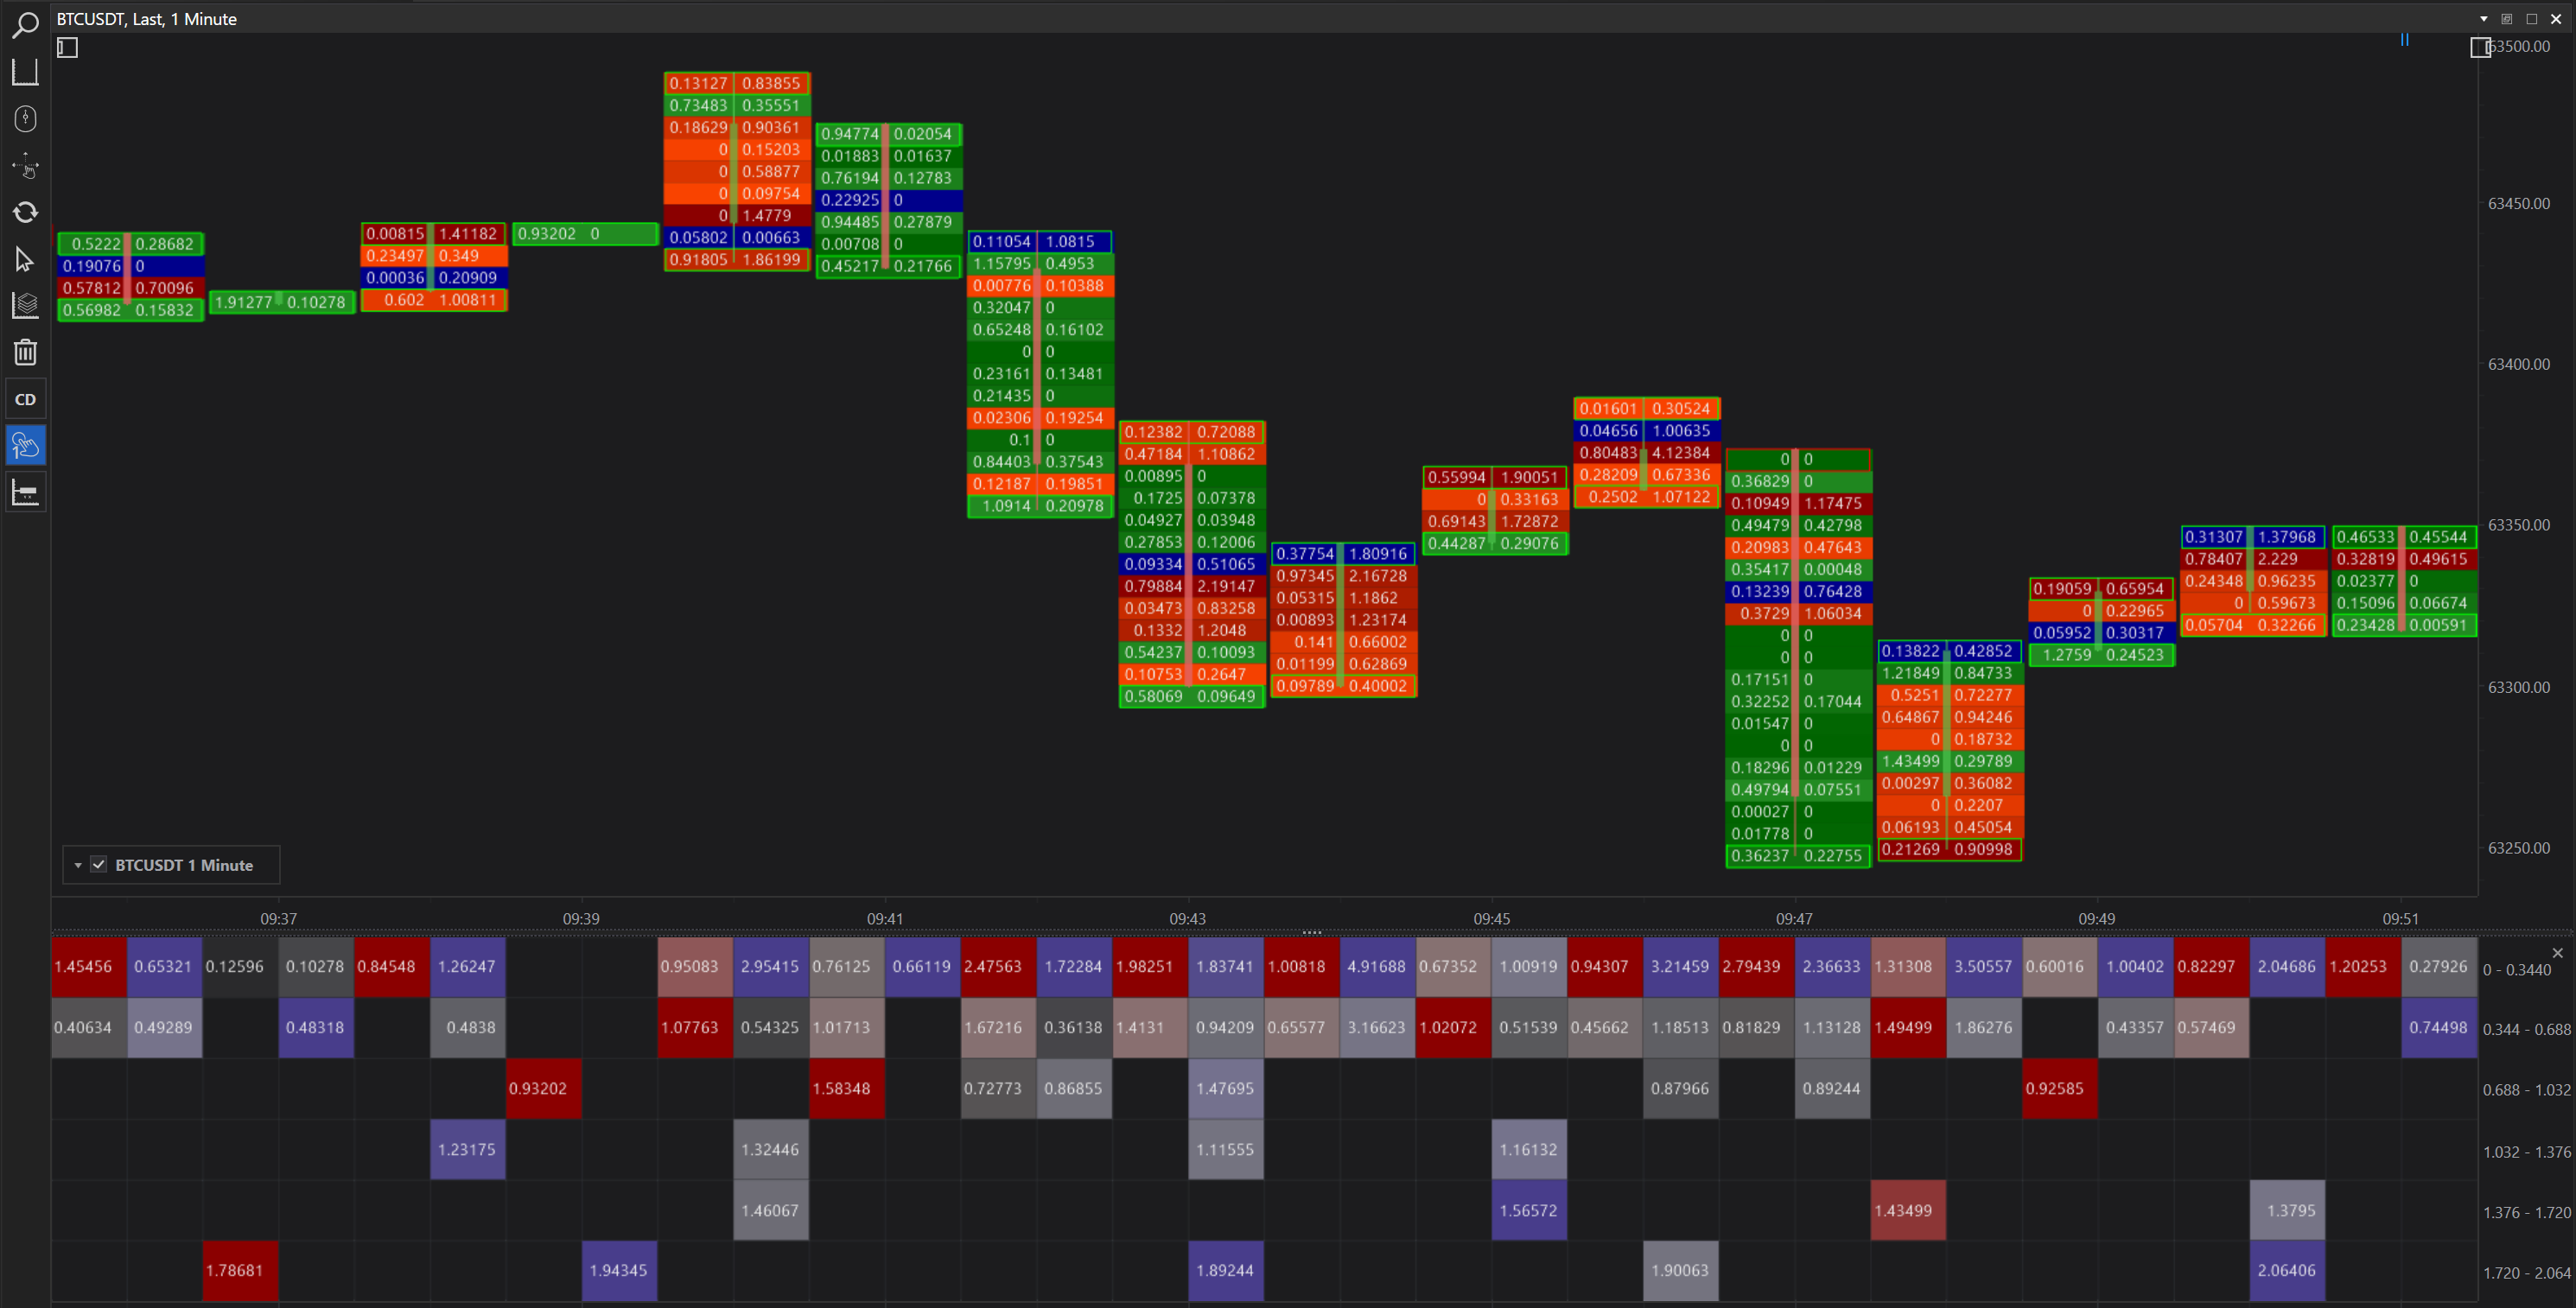
Order Size Levels
Description: Displays levels where significant orders were placed, highlighting the sizes of these orders.
Utility: Traders can identify potential support and resistance levels based on where large orders are clustered. This is particularly useful for spotting likely price barriers or targets.
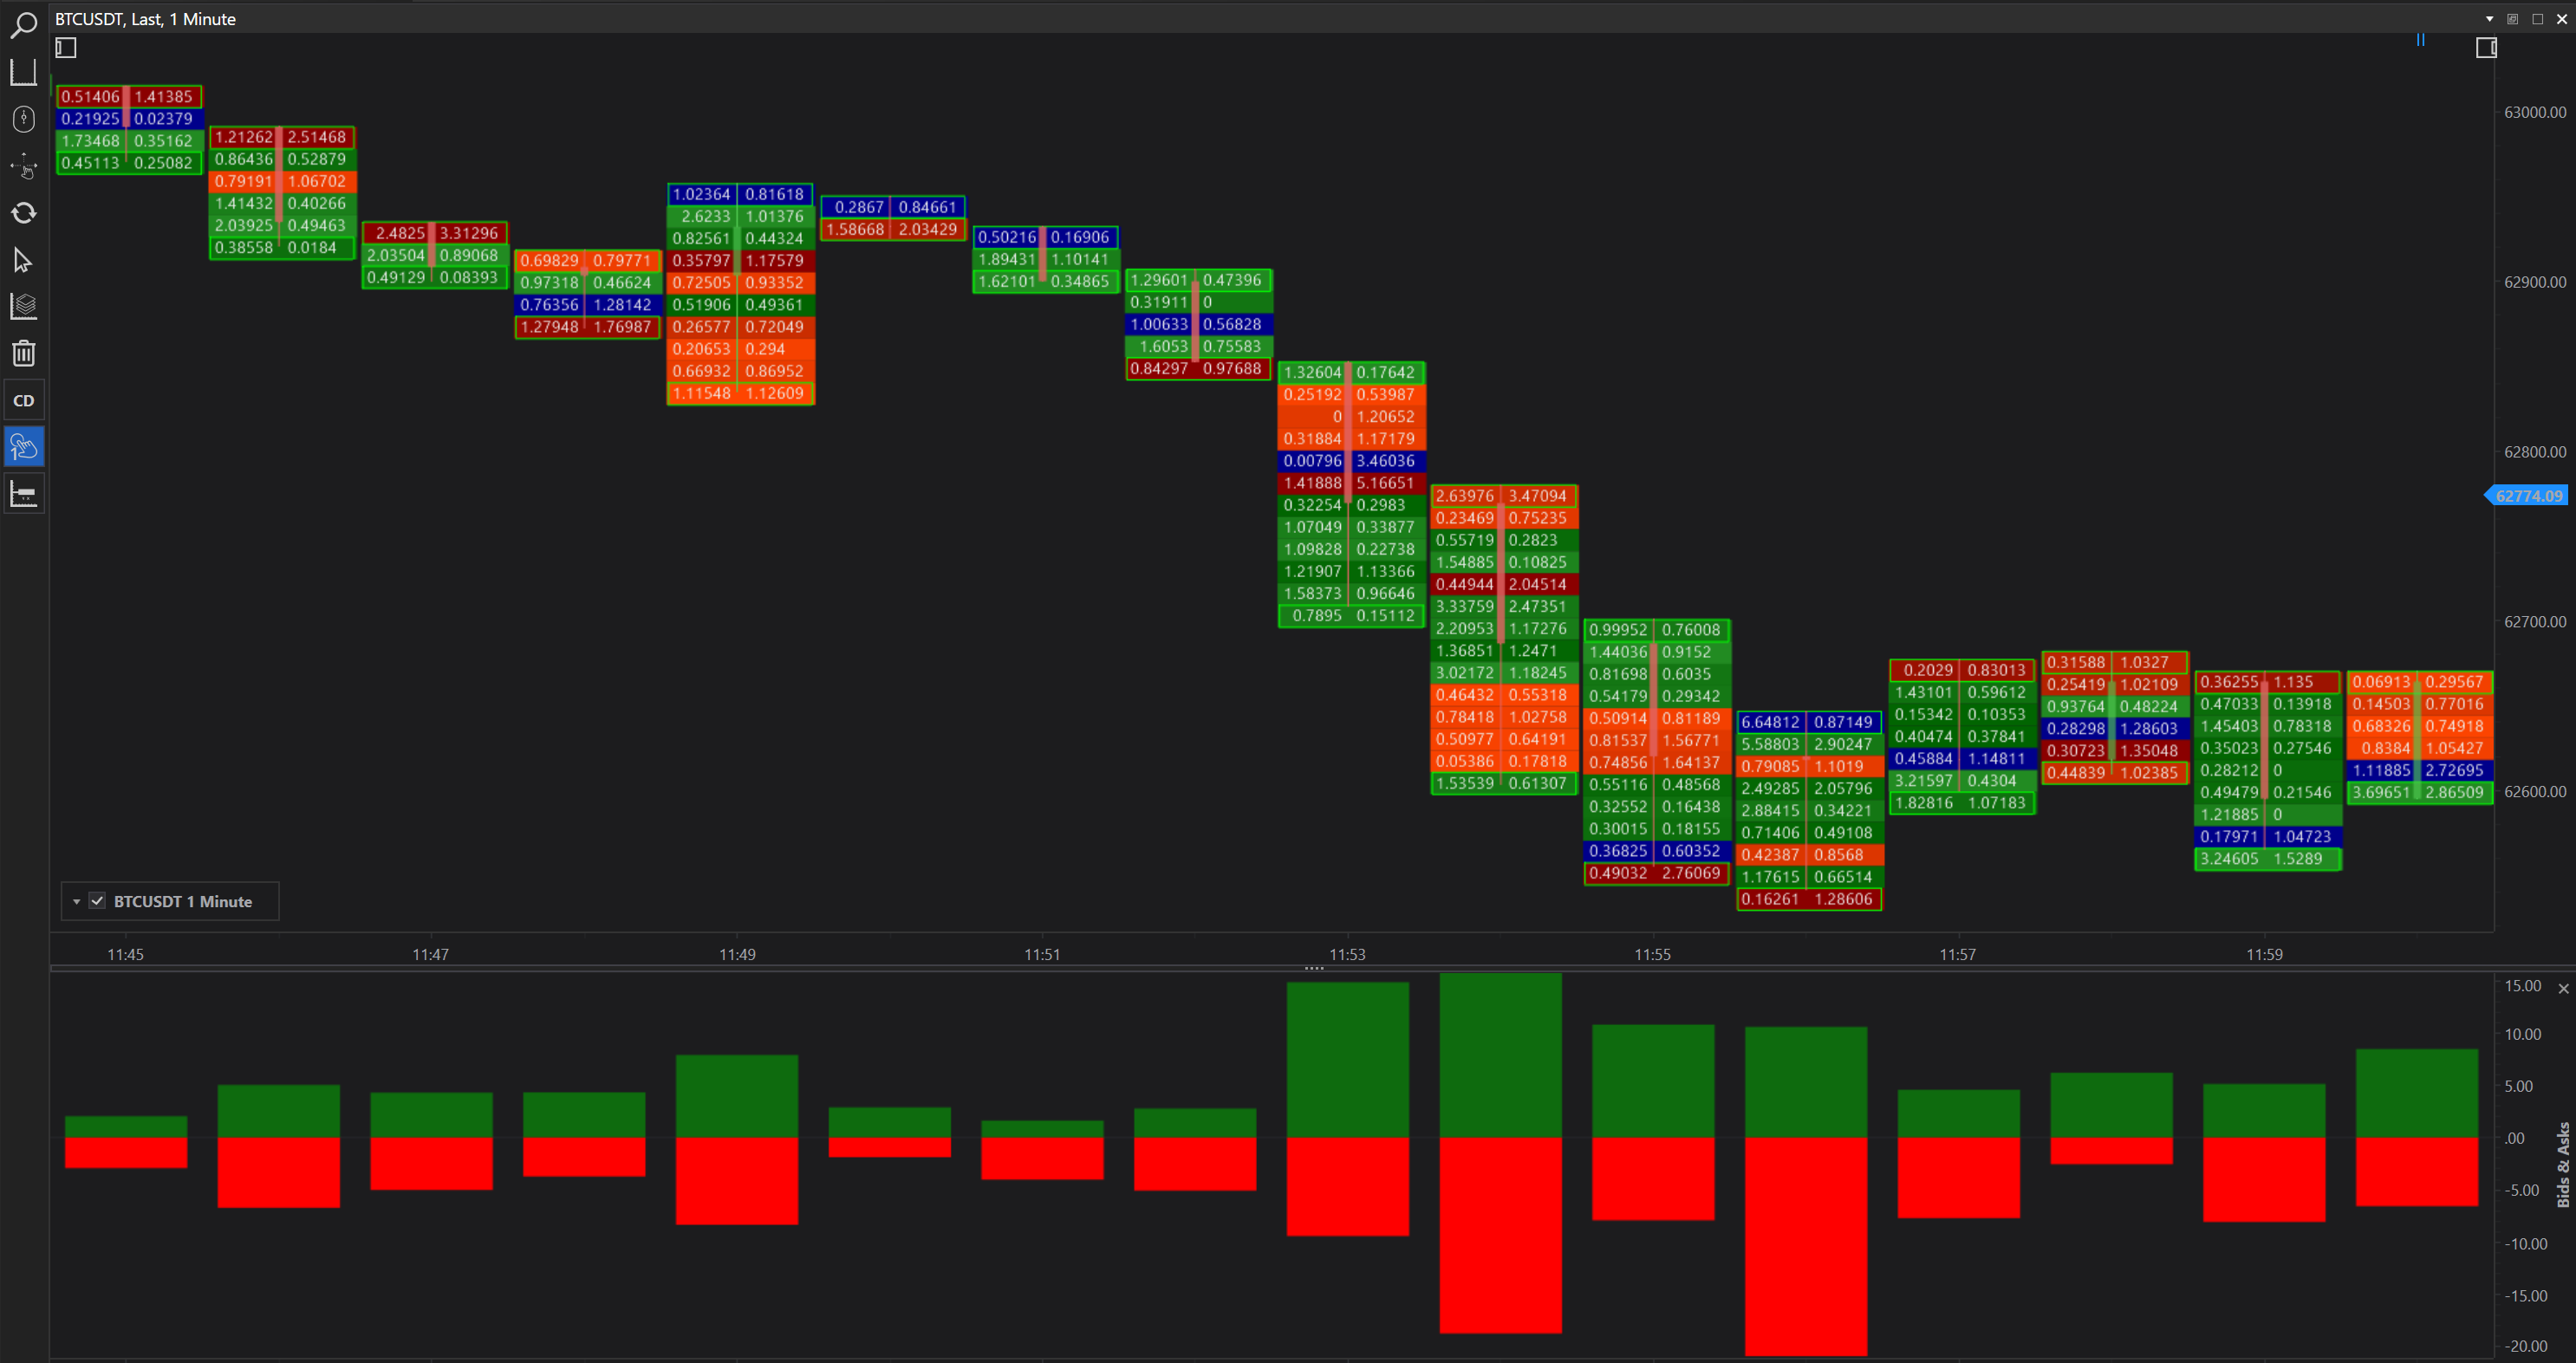
Bid Ask
Description: Shows the detailed dynamics between bid and ask prices over time, illustrating the spread and the pressure from buyers and sellers.
Utility: Essential for understanding market sentiment and liquidity. A narrow spread often indicates a healthy market with good liquidity, whereas wider spreads can signal volatility or lower liquidity.
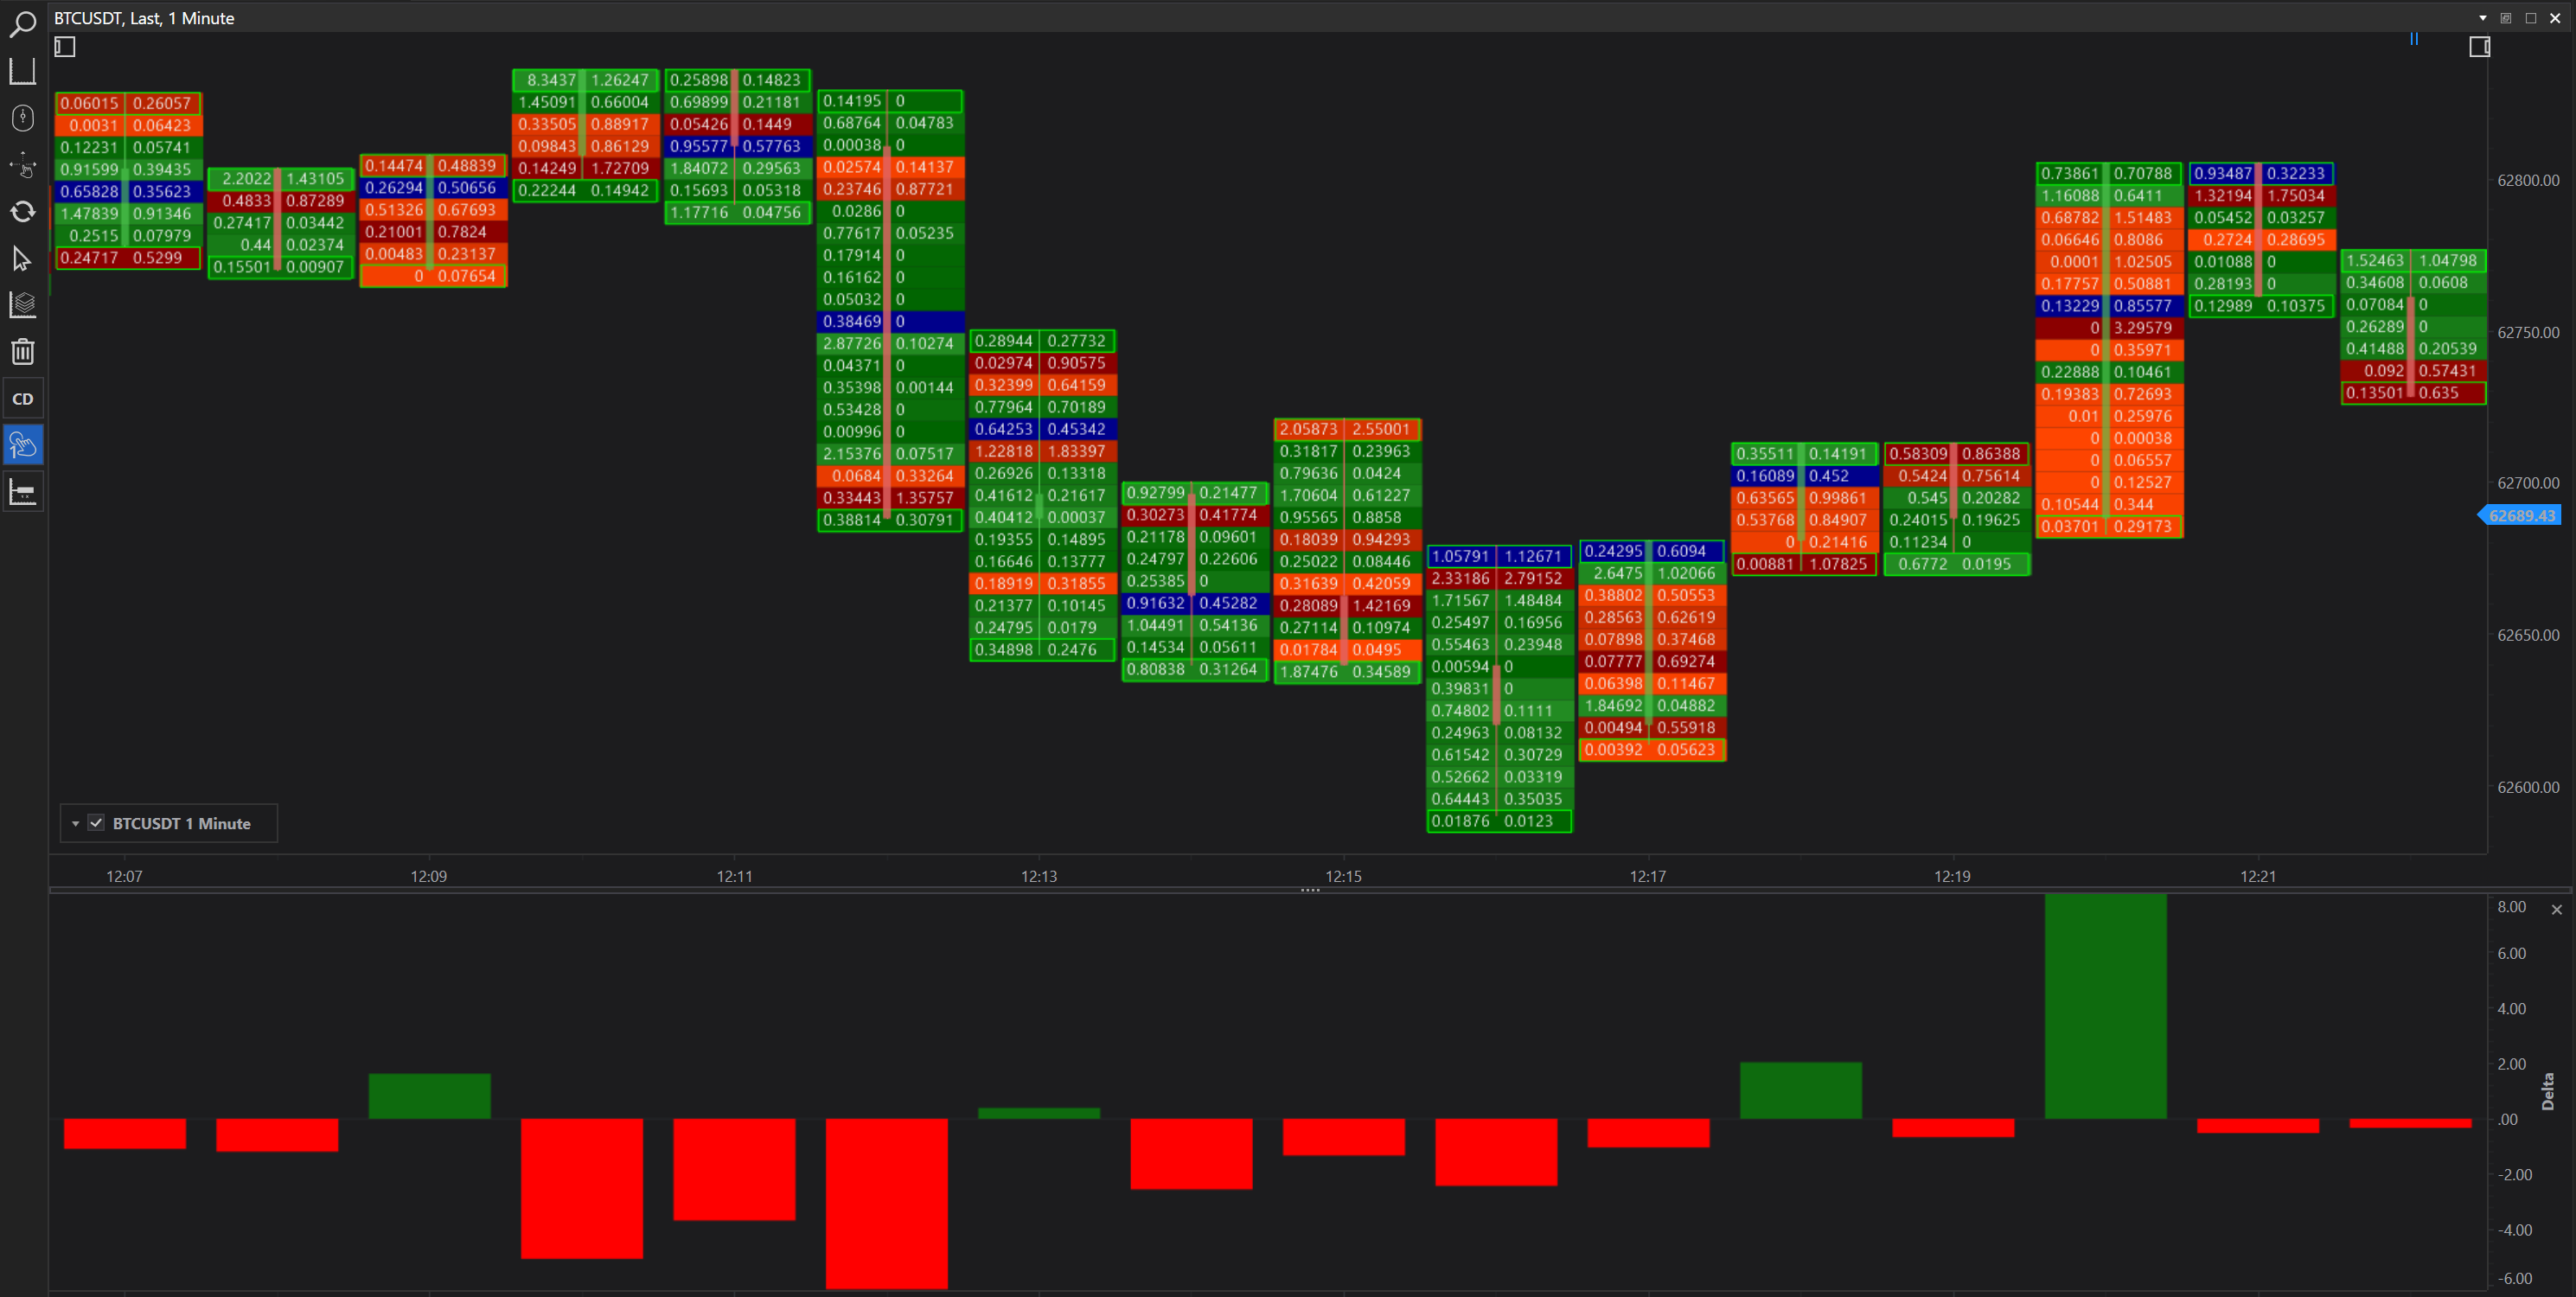
Delta
Description: Calculates the net difference between the volume of buying and selling, showing whether buyers or sellers are dominating the trading session.
Utility: Delta helps in identifying momentum or potential reversals. Positive delta suggests buying pressure, while negative delta indicates selling pressure, which can be pivotal in decision-making.
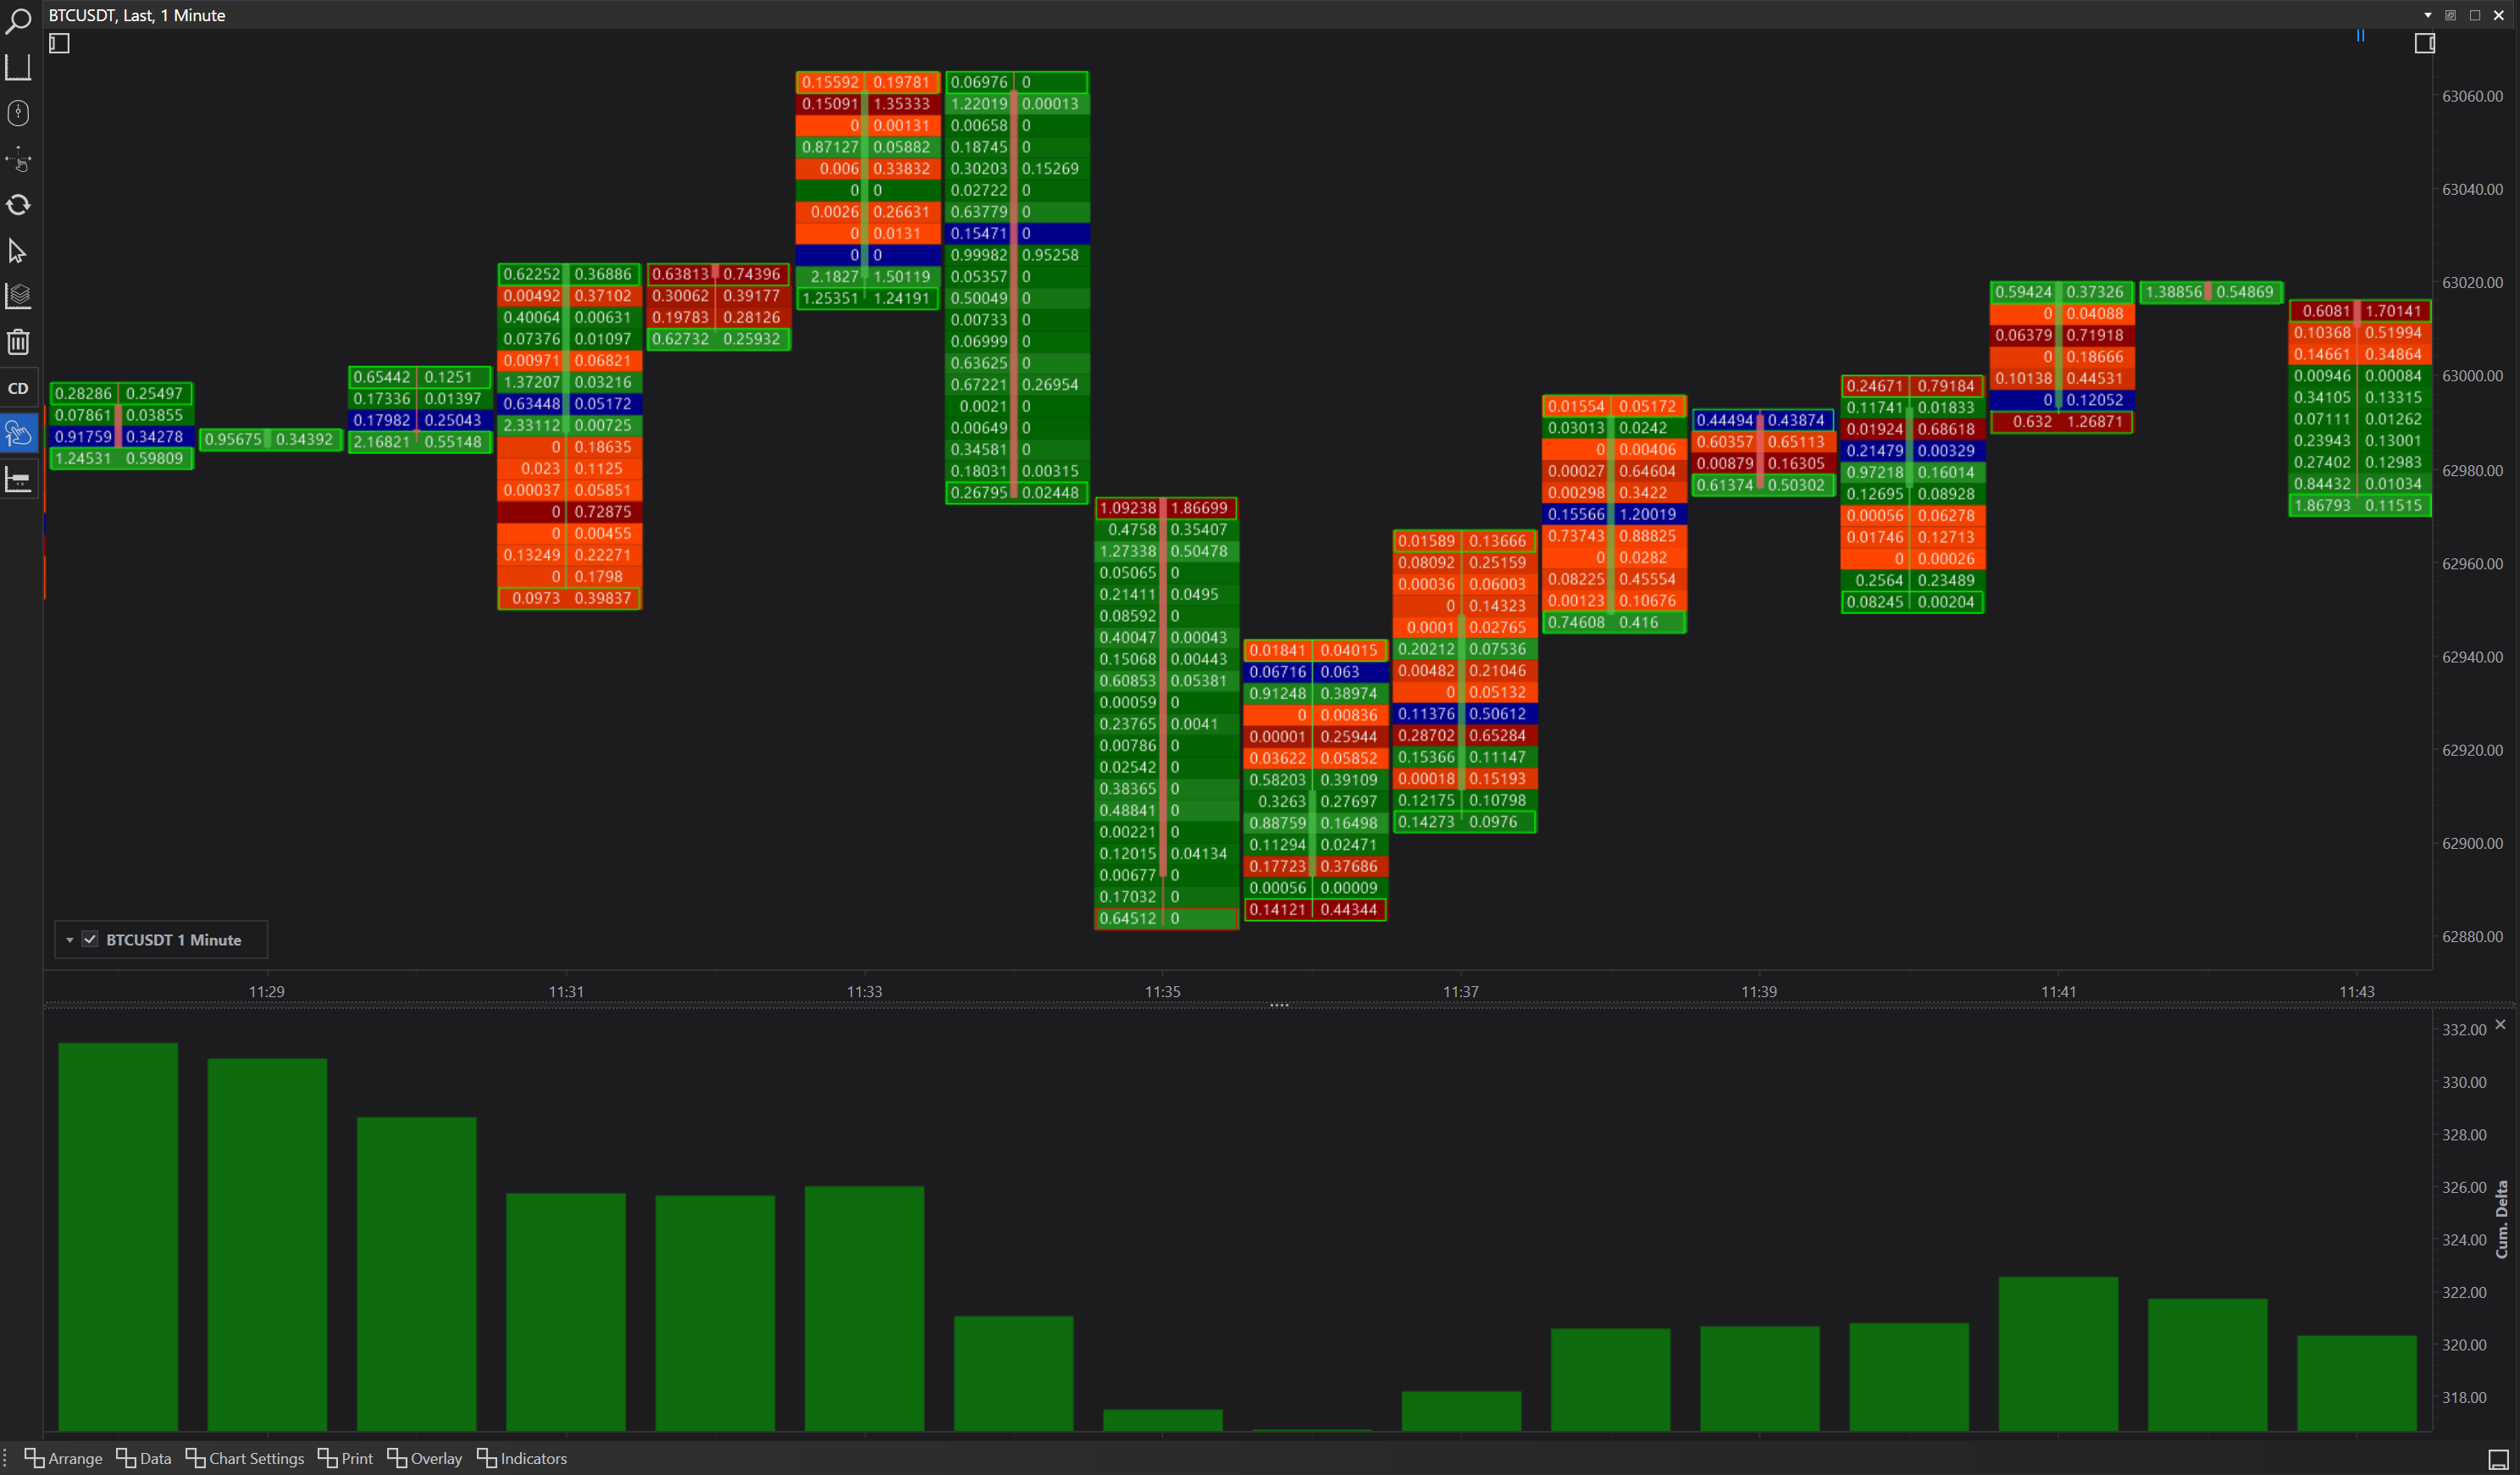
Cumulative Delta
Description: Aggregates the delta over time to provide a running total, giving a broader view of market trends.
Utility: This indicator is valuable for spotting long-term trends in buying or selling pressure. It can highlight underlying strength or weakness in the market that may not be apparent from price action alone.
Integrating Indicators with Cluster Charts
-
Complementary Analysis: Each of these indicators complements the data shown in cluster charts by providing additional layers of analysis. For example, while cluster charts can show where trades are concentrated, delta and cumulative delta can indicate whether these trades are predominantly buys or sells.
-
Strategic Placement: The placement of these indicators below the main chart allows traders to correlate specific price movements with changes in indicator values directly. This setup helps in drawing quicker conclusions about market conditions.
-
Configurability: Traders have the flexibility to configure which indicators to display according to their analysis needs. This customization ensures that the dashboard remains uncluttered while providing all necessary data.
Conclusion
The indicators available for Cluster Charts in FinStudio significantly enhance the analytical power of traders by providing deeper insights into market behavior. Whether it’s understanding the immediate statistical data of trading bars or long-term trends in market pressure, these indicators furnish traders with a comprehensive toolkit for detailed market analysis. By effectively leveraging these tools, traders can enhance their market understanding and improve their decision-making process in trading scenarios.