Cluster Charts - Overlay Options in FinStudio
FinStudio's Cluster Charts not only provide detailed data prints on each candle but also allow for the overlay of various analytical tools to enhance market visualization and depth analysis. These overlays help traders to interpret market behavior more effectively by adding layers of data over the basic price action displayed by the candle bar charts. Here, we detail each overlay option available and its applications in trading.
Available Overlay Options for Cluster Charts
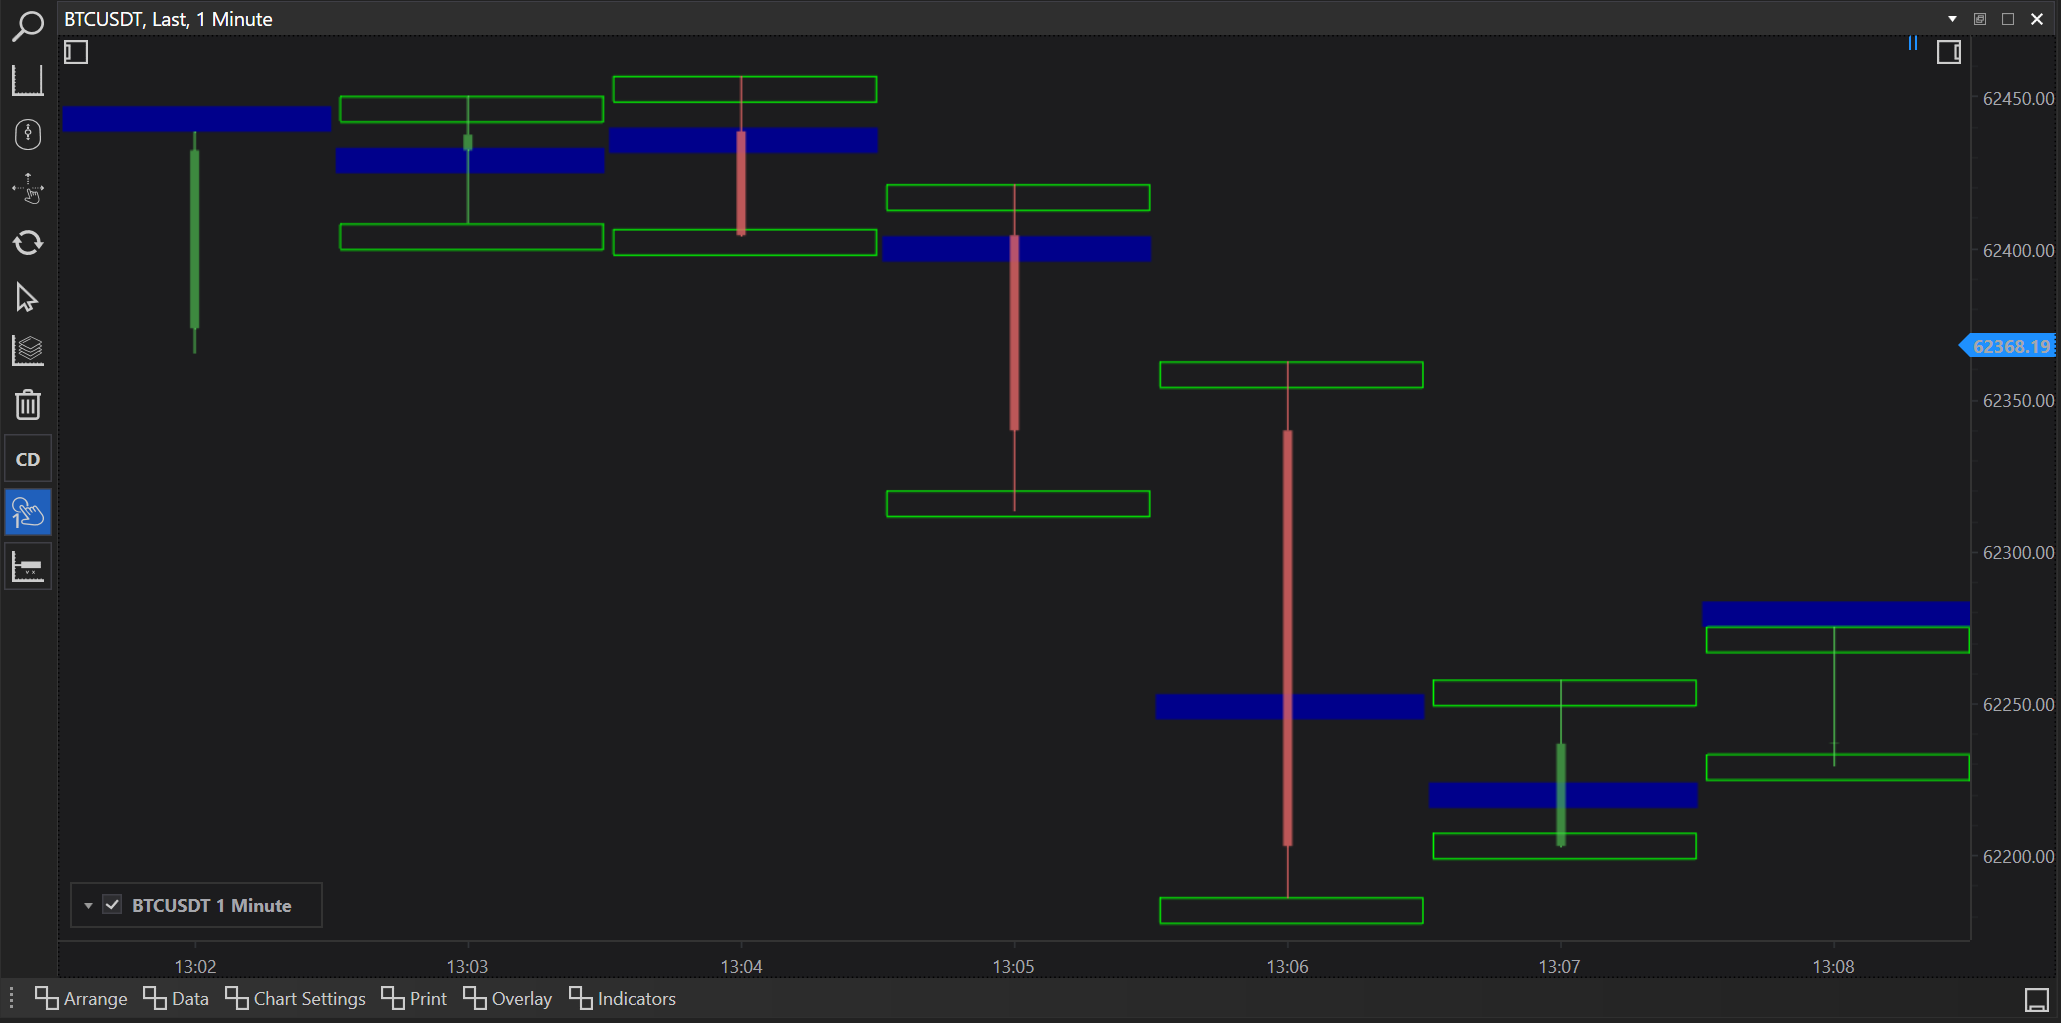
None
Description: No additional data is overlayed on the chart, presenting a clean and straightforward view of price movements.
Use Case: Ideal for traders who prefer minimalistic charts or when focusing solely on price action without additional complexity.
Volume Cluster
Description: This overlay displays the volume traded at each price level across the chart, providing a visual representation of trading activity.
Use Case: Useful for identifying high-volume nodes which can signify areas of strong support or resistance.

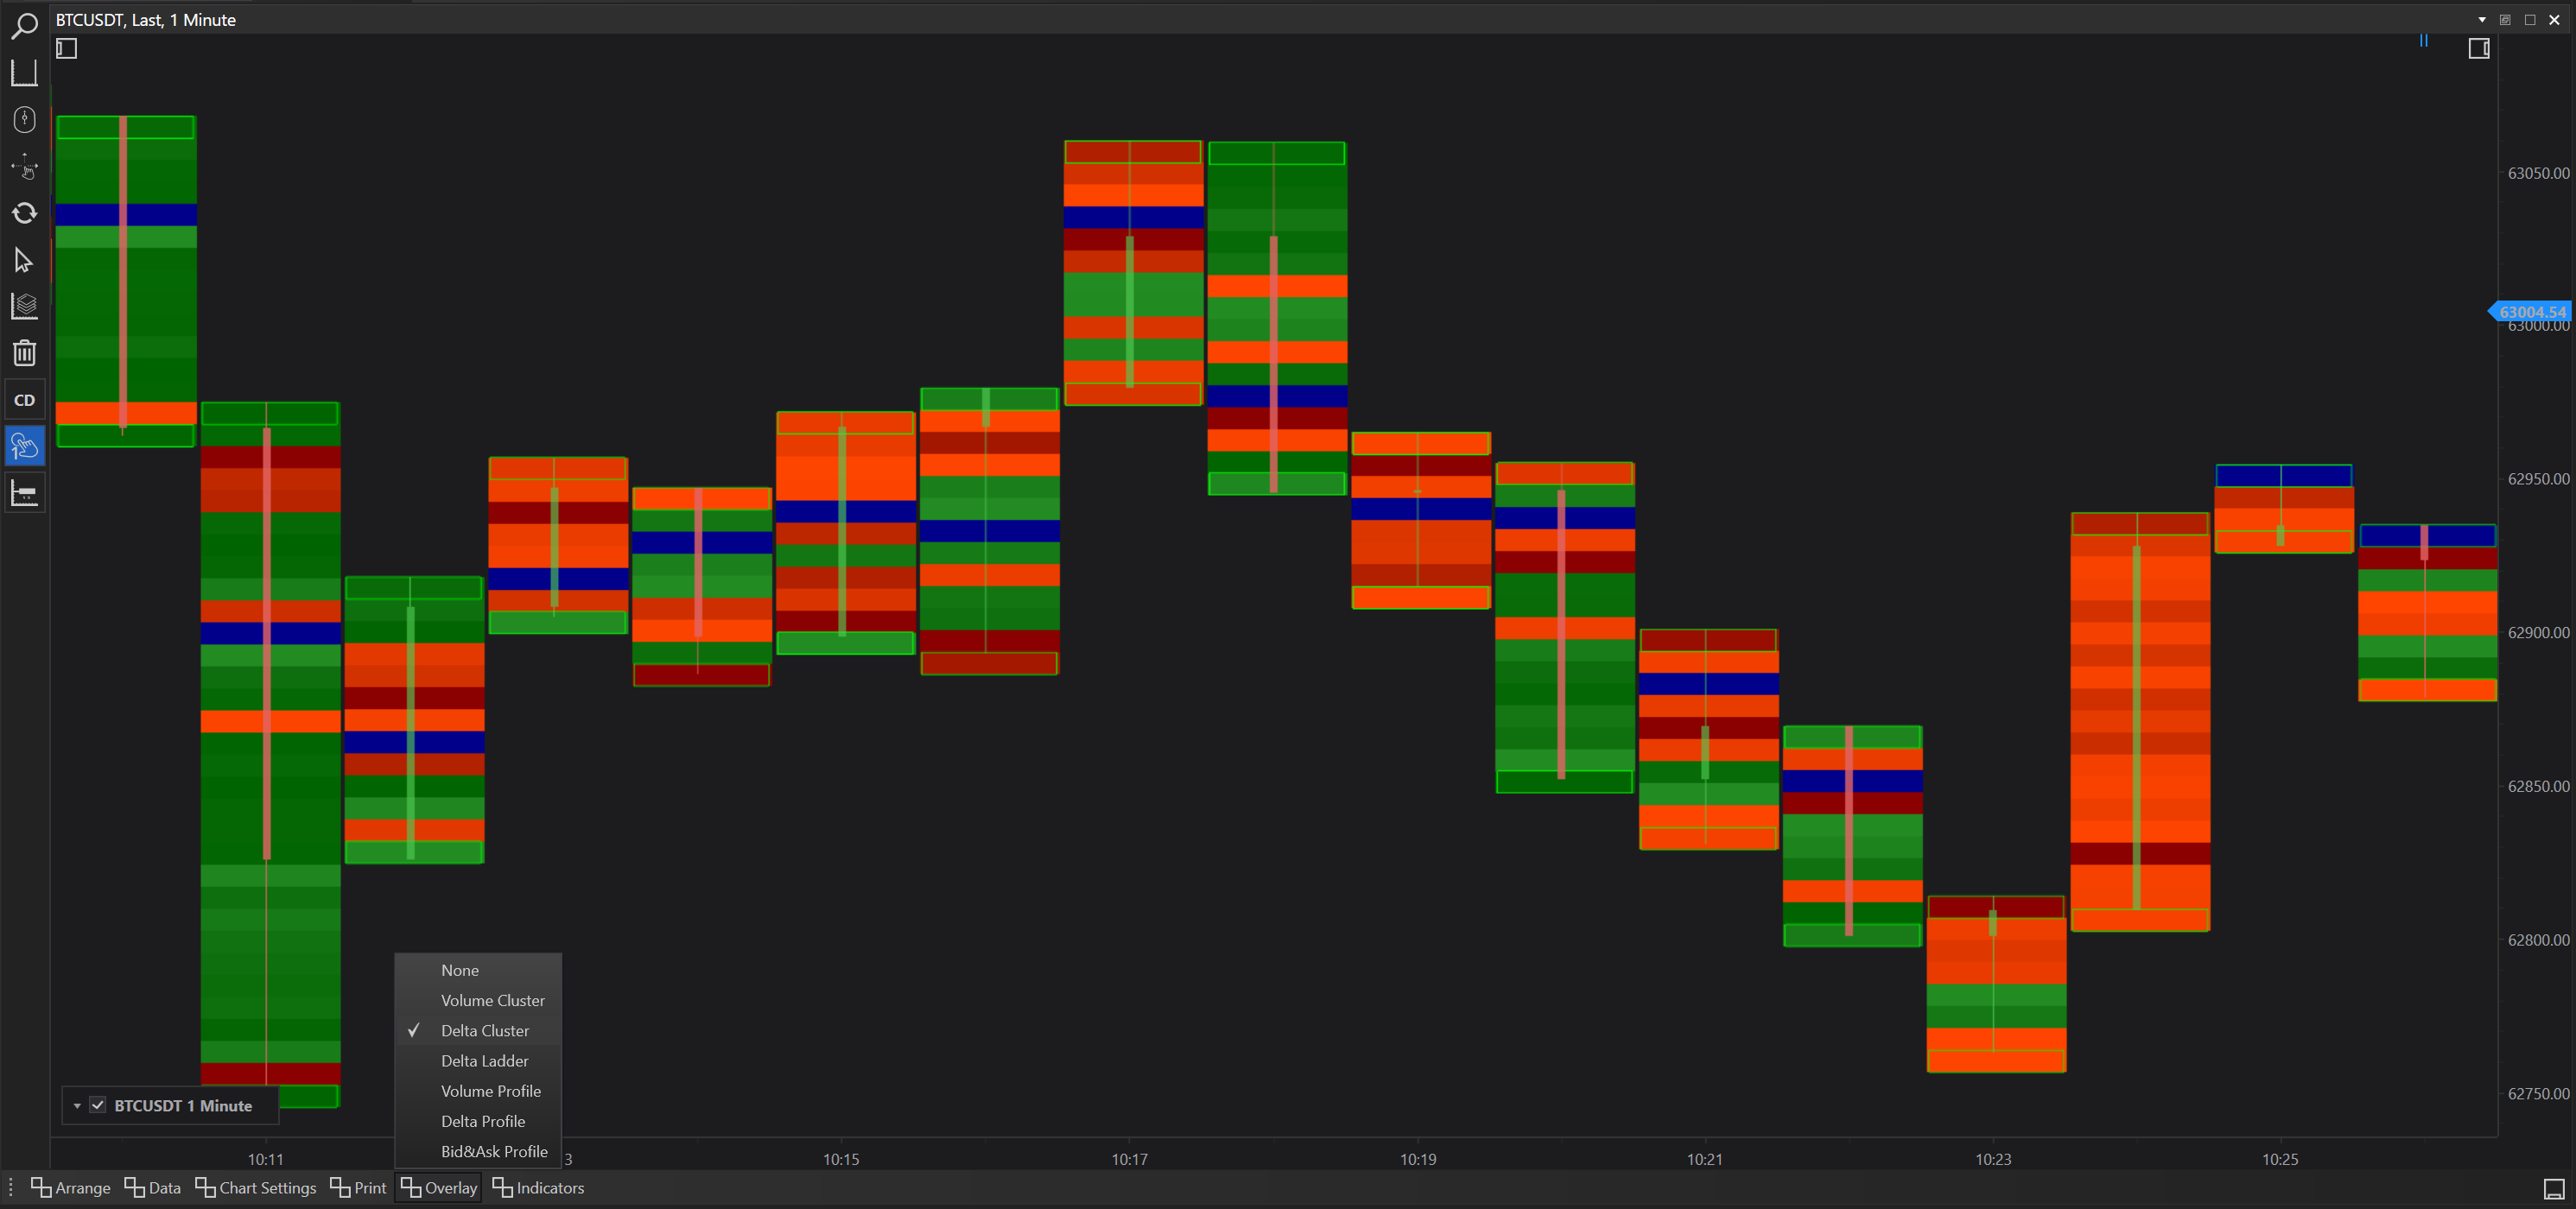
Delta Cluster
Description: Shows the net difference in volume between buys and sells at each price level, indicating the balance of market power.
Use Case: Helps in identifying momentum or potential exhaustion points where one side of the market is overpowering the other.
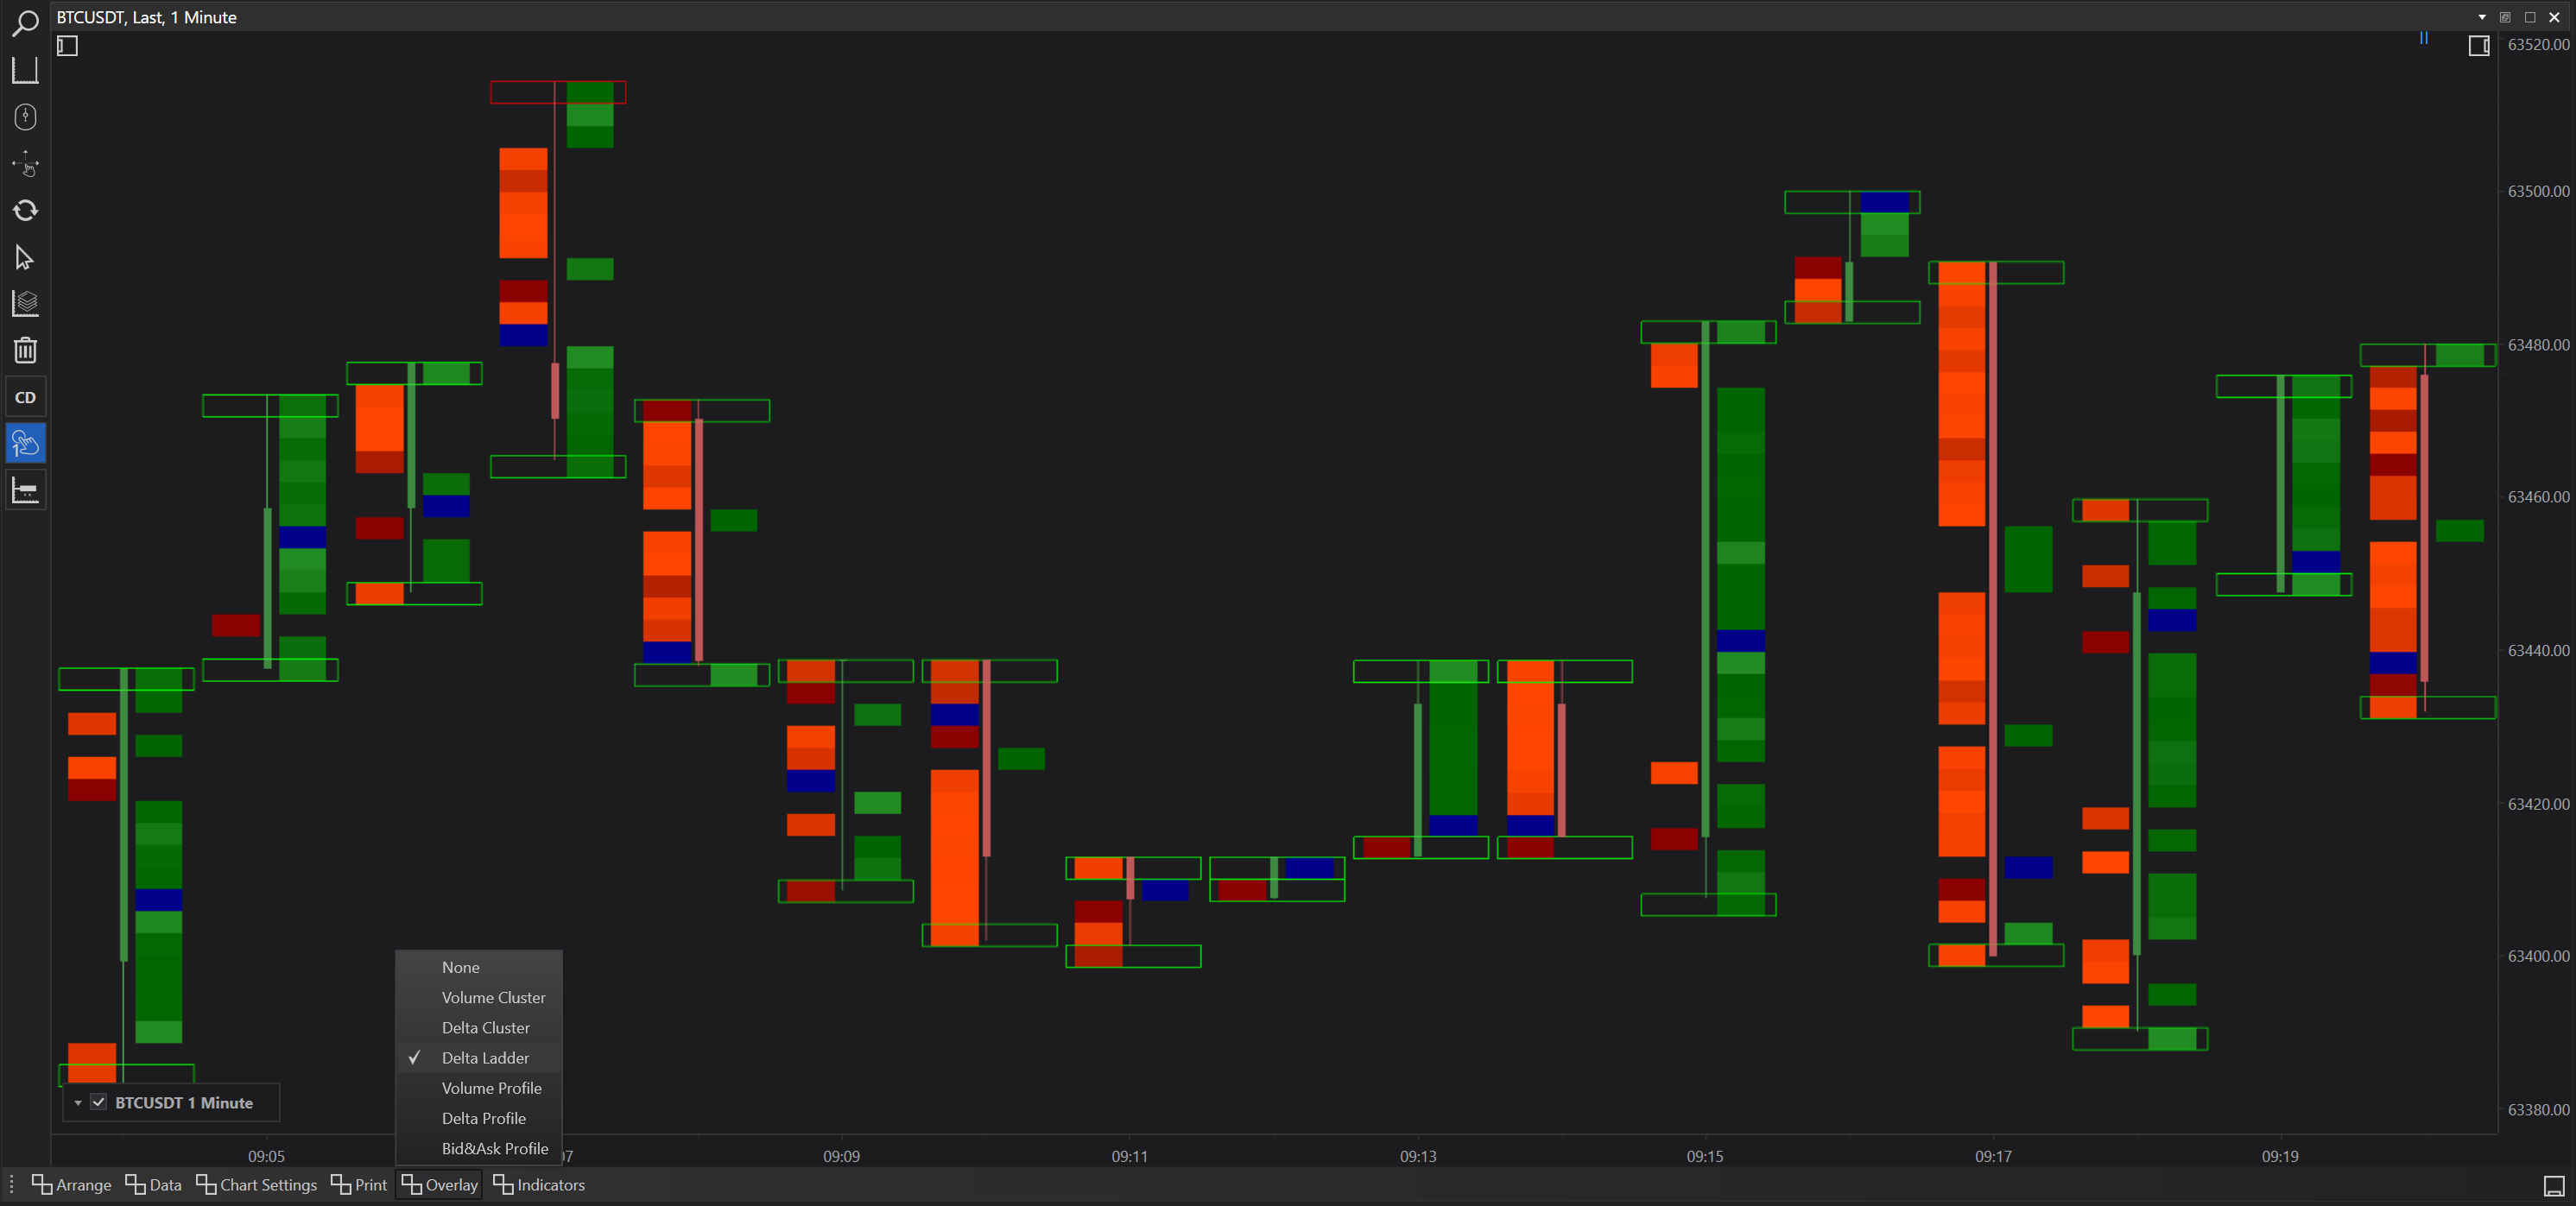
Delta Ladder
Description: Visualizes the cumulative delta as a step ladder, making it easier to observe the trend of buying vs. selling pressure over time.
Use Case: Effective for spotting trends in buying or selling pressure, useful in trend-following or reversal strategies.
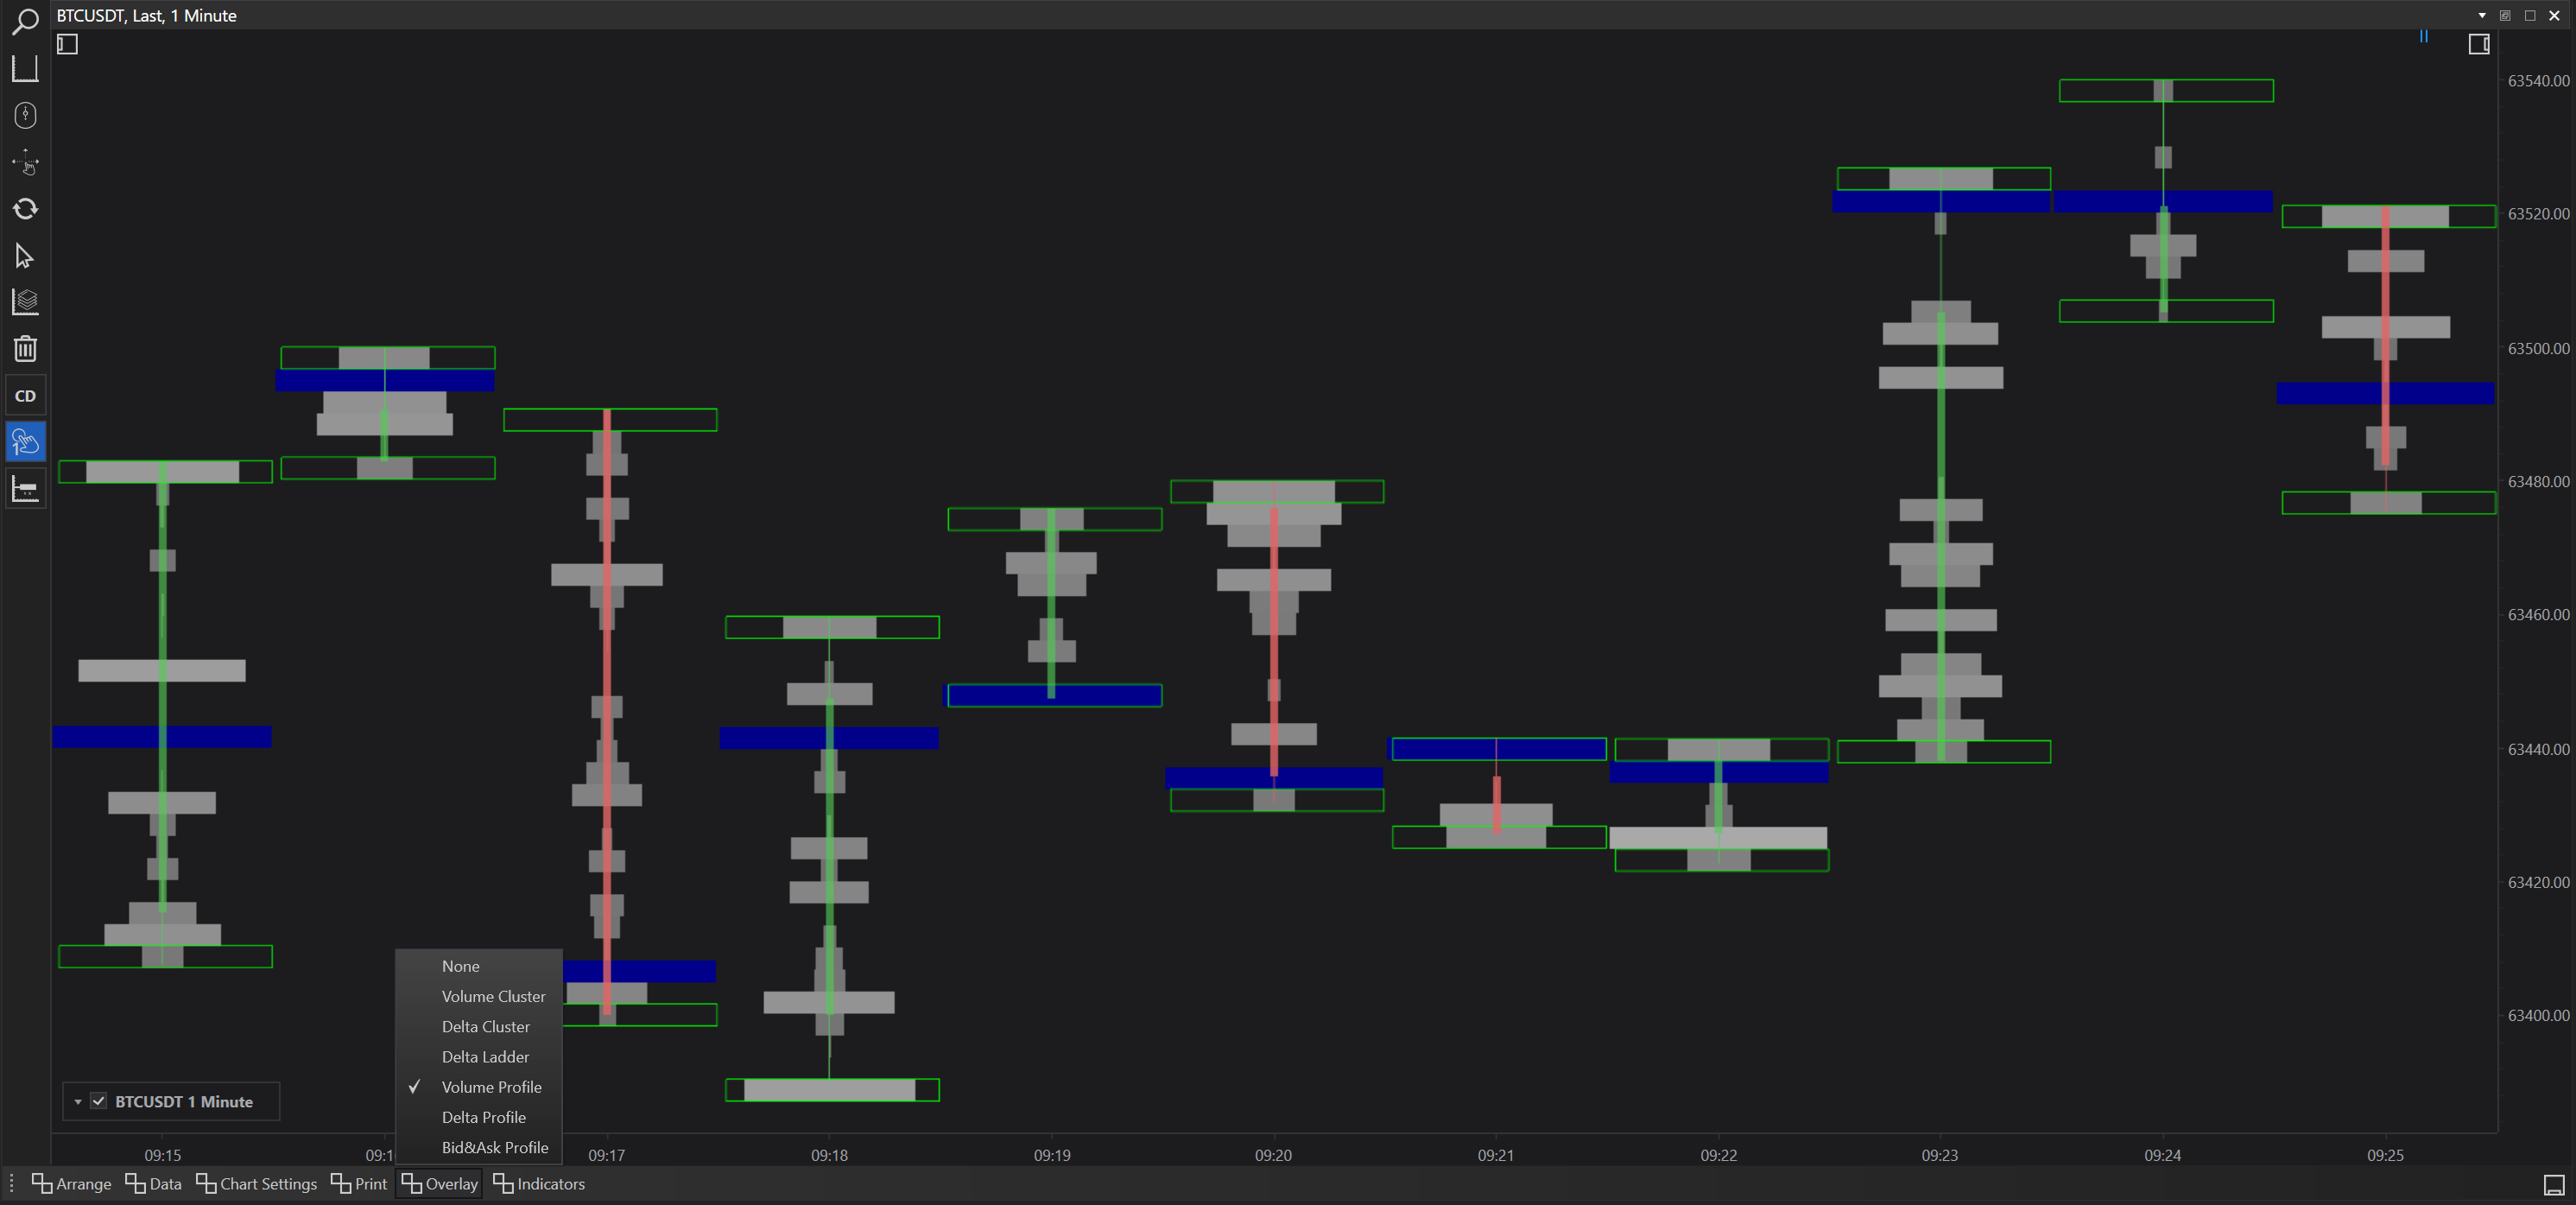
Volume Profile
Description: A histogram of volume distributed over various price levels during the analyzed time frame.
Use Case: Enables traders to see where the majority of trading activity took place and identify potential pivot levels based on volume accumulations.
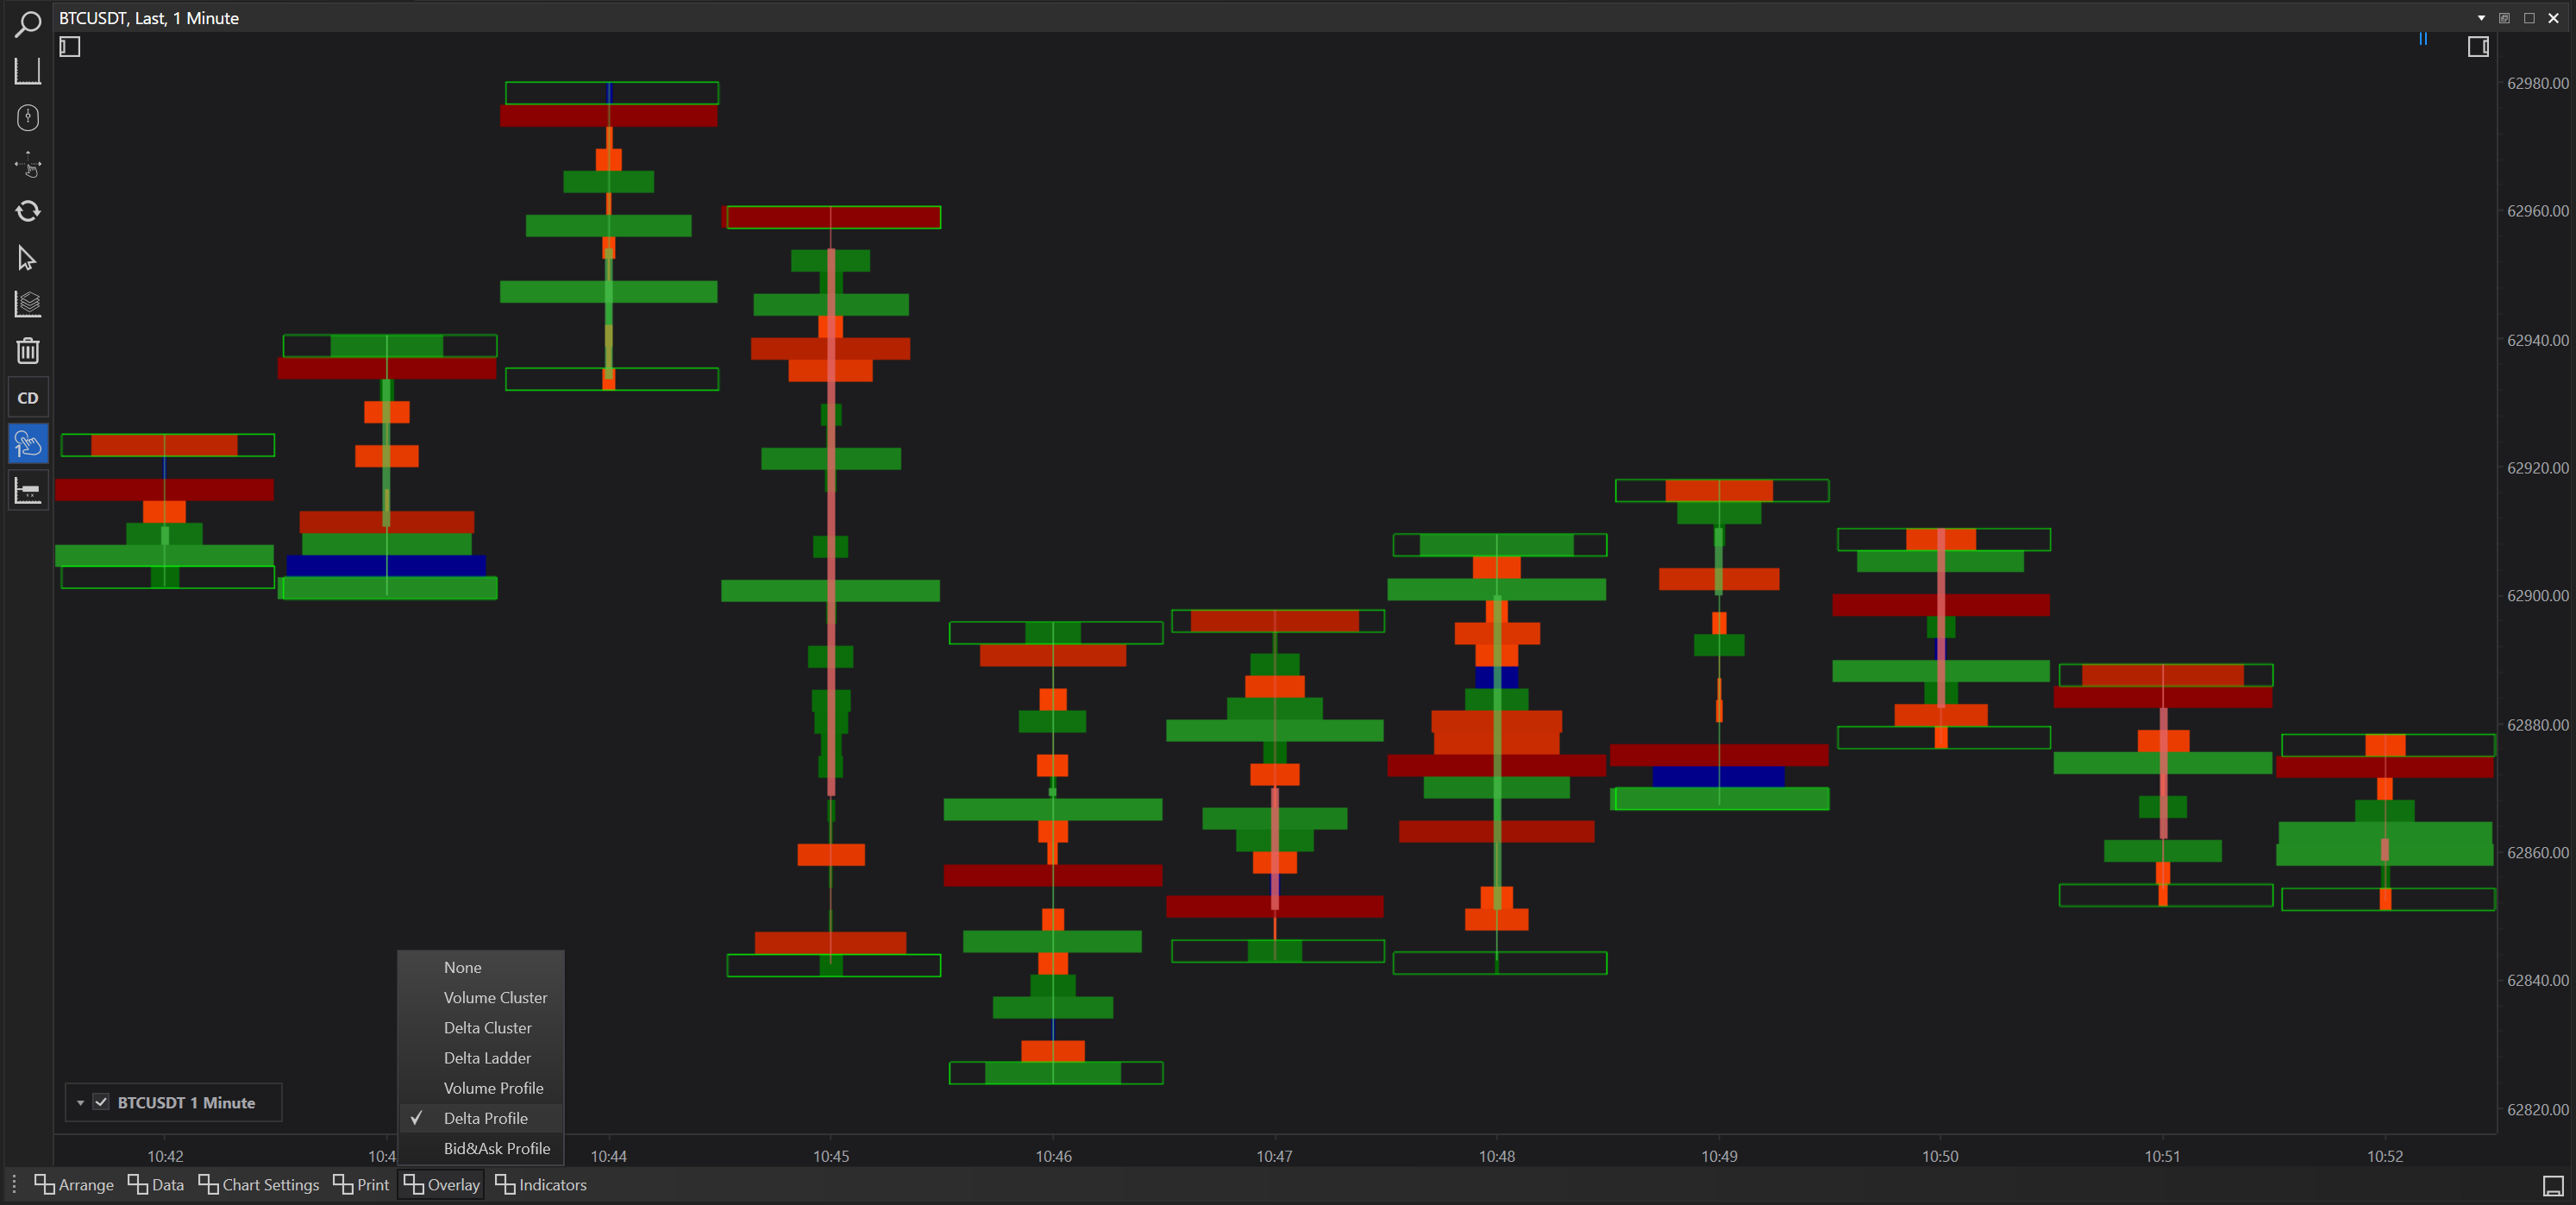
Delta Profile
Description: Similar to Volume Profile but shows the net delta at each price level instead.
Use Case: Useful for understanding where aggressive buying or selling occurred and gauging the strength of market moves.
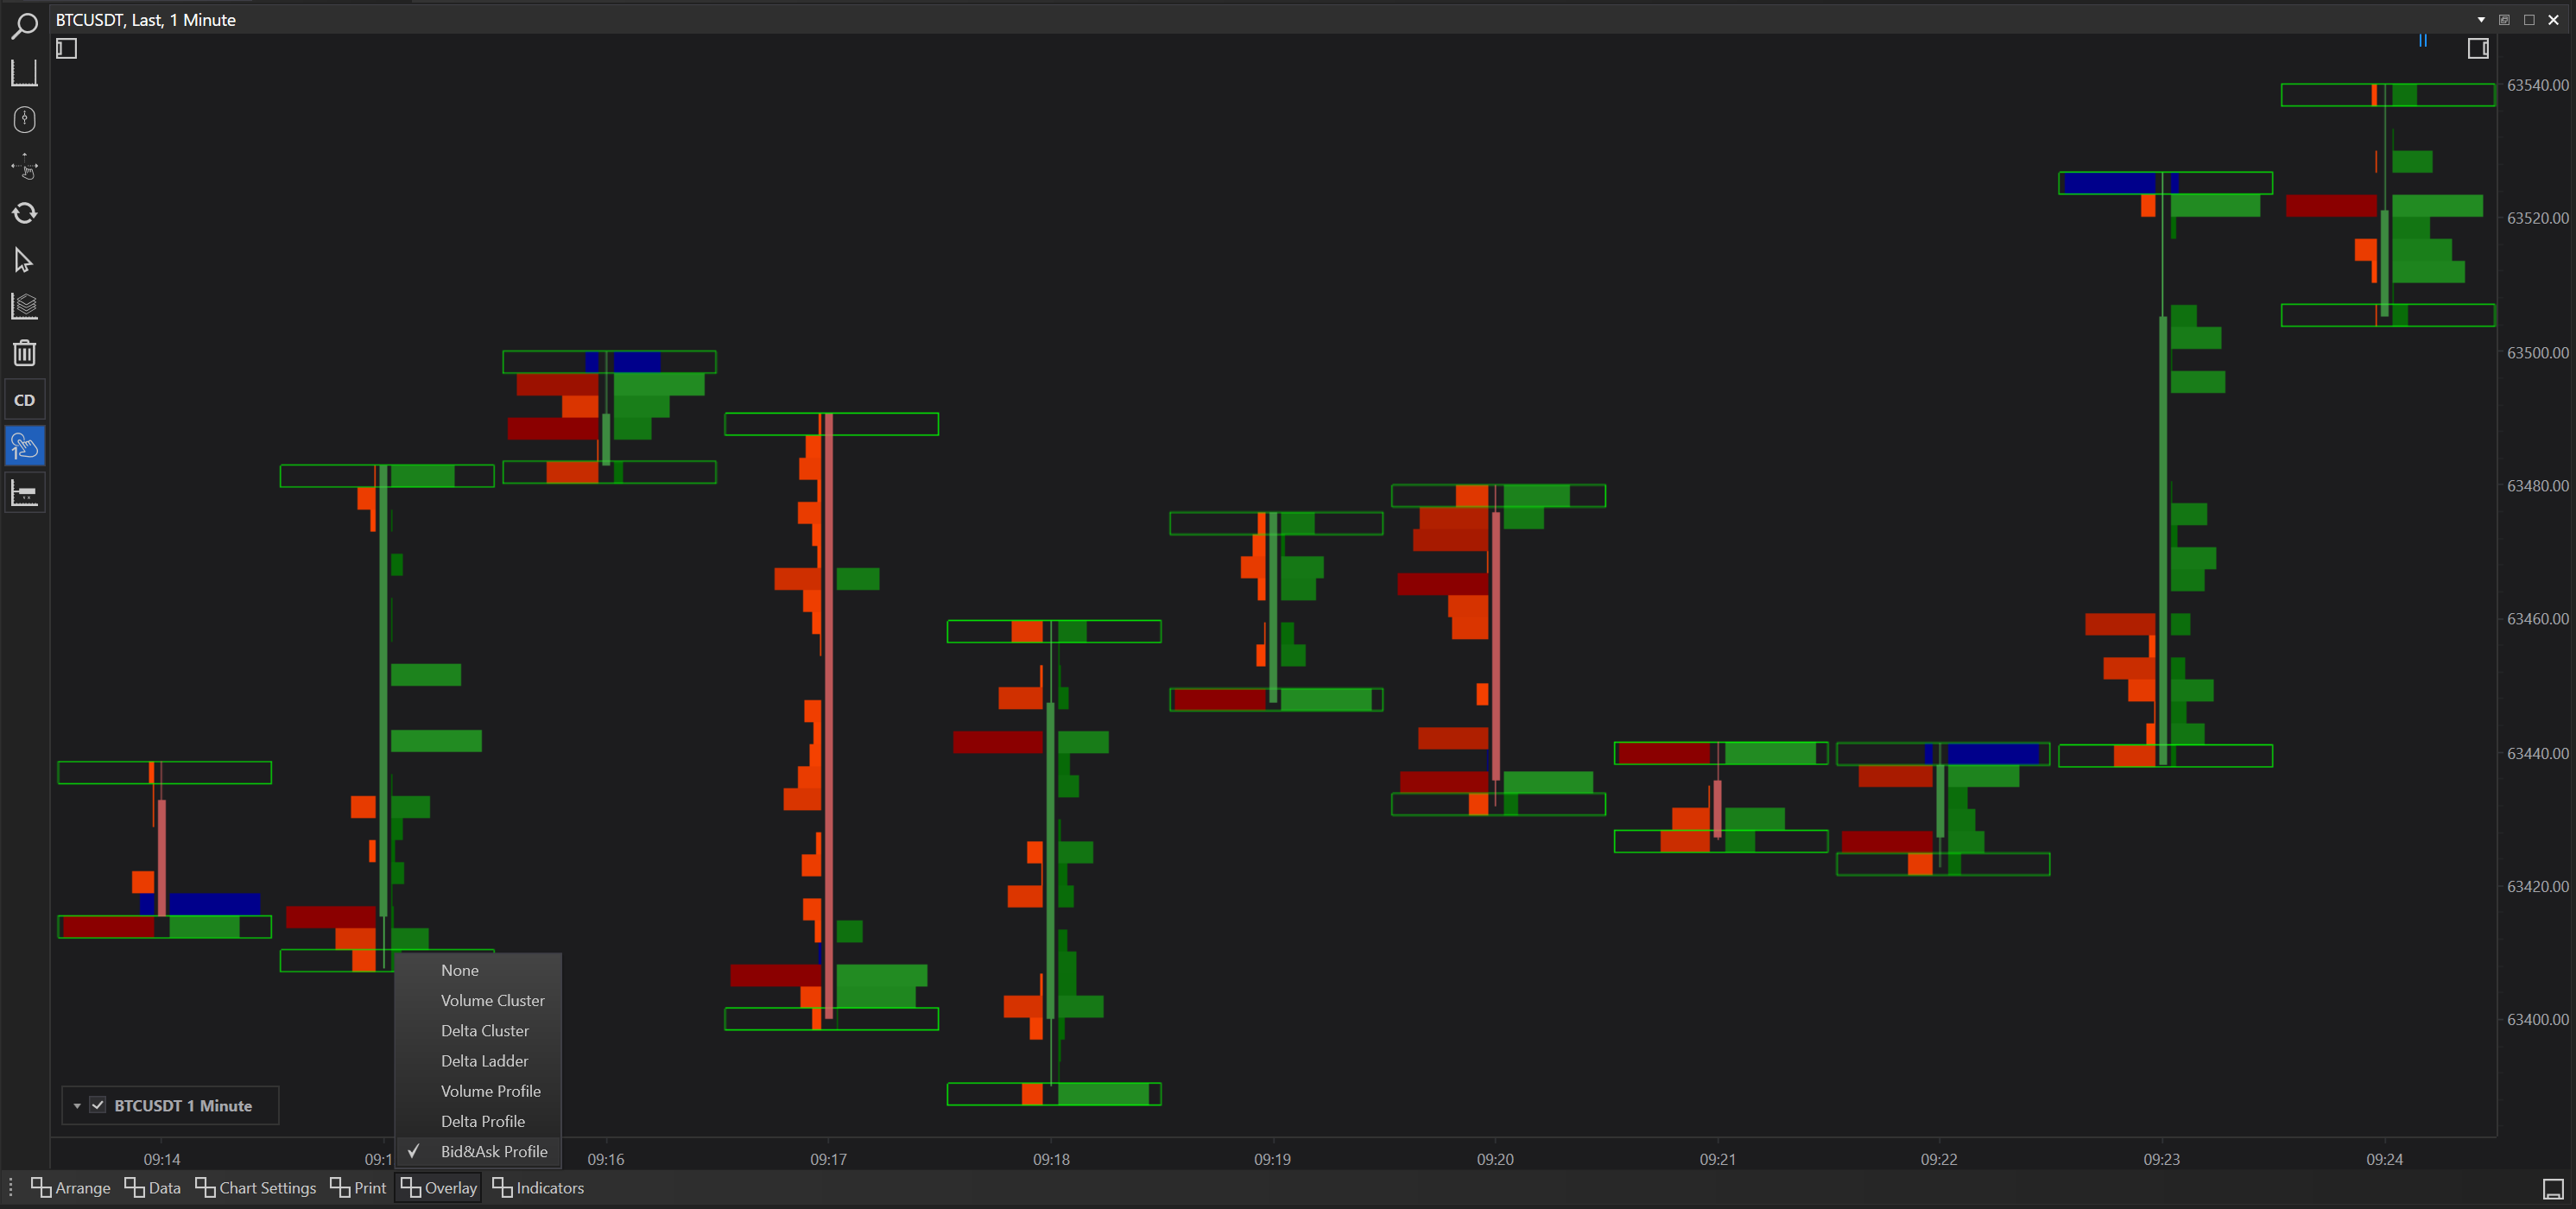
Bid & Ask Profile
Description: This overlay breaks down the volume profile into separate bid and ask components, showing the depth of market on both sides of the price.
Use Case: Provides insights into demand and supply dynamics at different price levels, helping traders understand potential reaction points in the market.
How to Leverage Overlay Options Effectively
-
Comprehensive Market Analysis: Using overlays can give a multi-dimensional view of the market, combining price action with volume and order flow insights to formulate well-rounded trading decisions.
-
Strategic Decision Making: Different overlays can be used depending on the trading scenario. For example, during high volatility, a Delta Profile might be more insightful to determine the direction of market pressure, whereas, in a range-bound market, the Volume Profile could help identify consolidation zones.
-
Enhanced Visualization: Overlays can make it easier to visualize complex data directly on the charts, enabling quicker and more intuitive analysis and response to changing market conditions.
Conclusion
The overlay options available in FinStudio's Cluster Charts are powerful tools that add significant analytical depth to the traditional charting methods. By applying these overlays, traders can gain a clearer understanding of the underlying market mechanics, better positioning themselves to capitalize on emerging opportunities. Whether you're a day trader or a long-term investor, these tools can provide valuable insights into market dynamics and help refine your trading strategies.