Cluster Charts - Print
Cluster charts in FinStudio offer a sophisticated way to visualize trading activity directly on each candle, providing traders with immediate insights into market dynamics. These charts can be customized to display various types of data, enhancing the trader's ability to make informed decisions based on detailed market analysis. Below, we explore the different print options available for Cluster charts in FinStudio and their respective applications.
Available Print Options for Cluster Charts
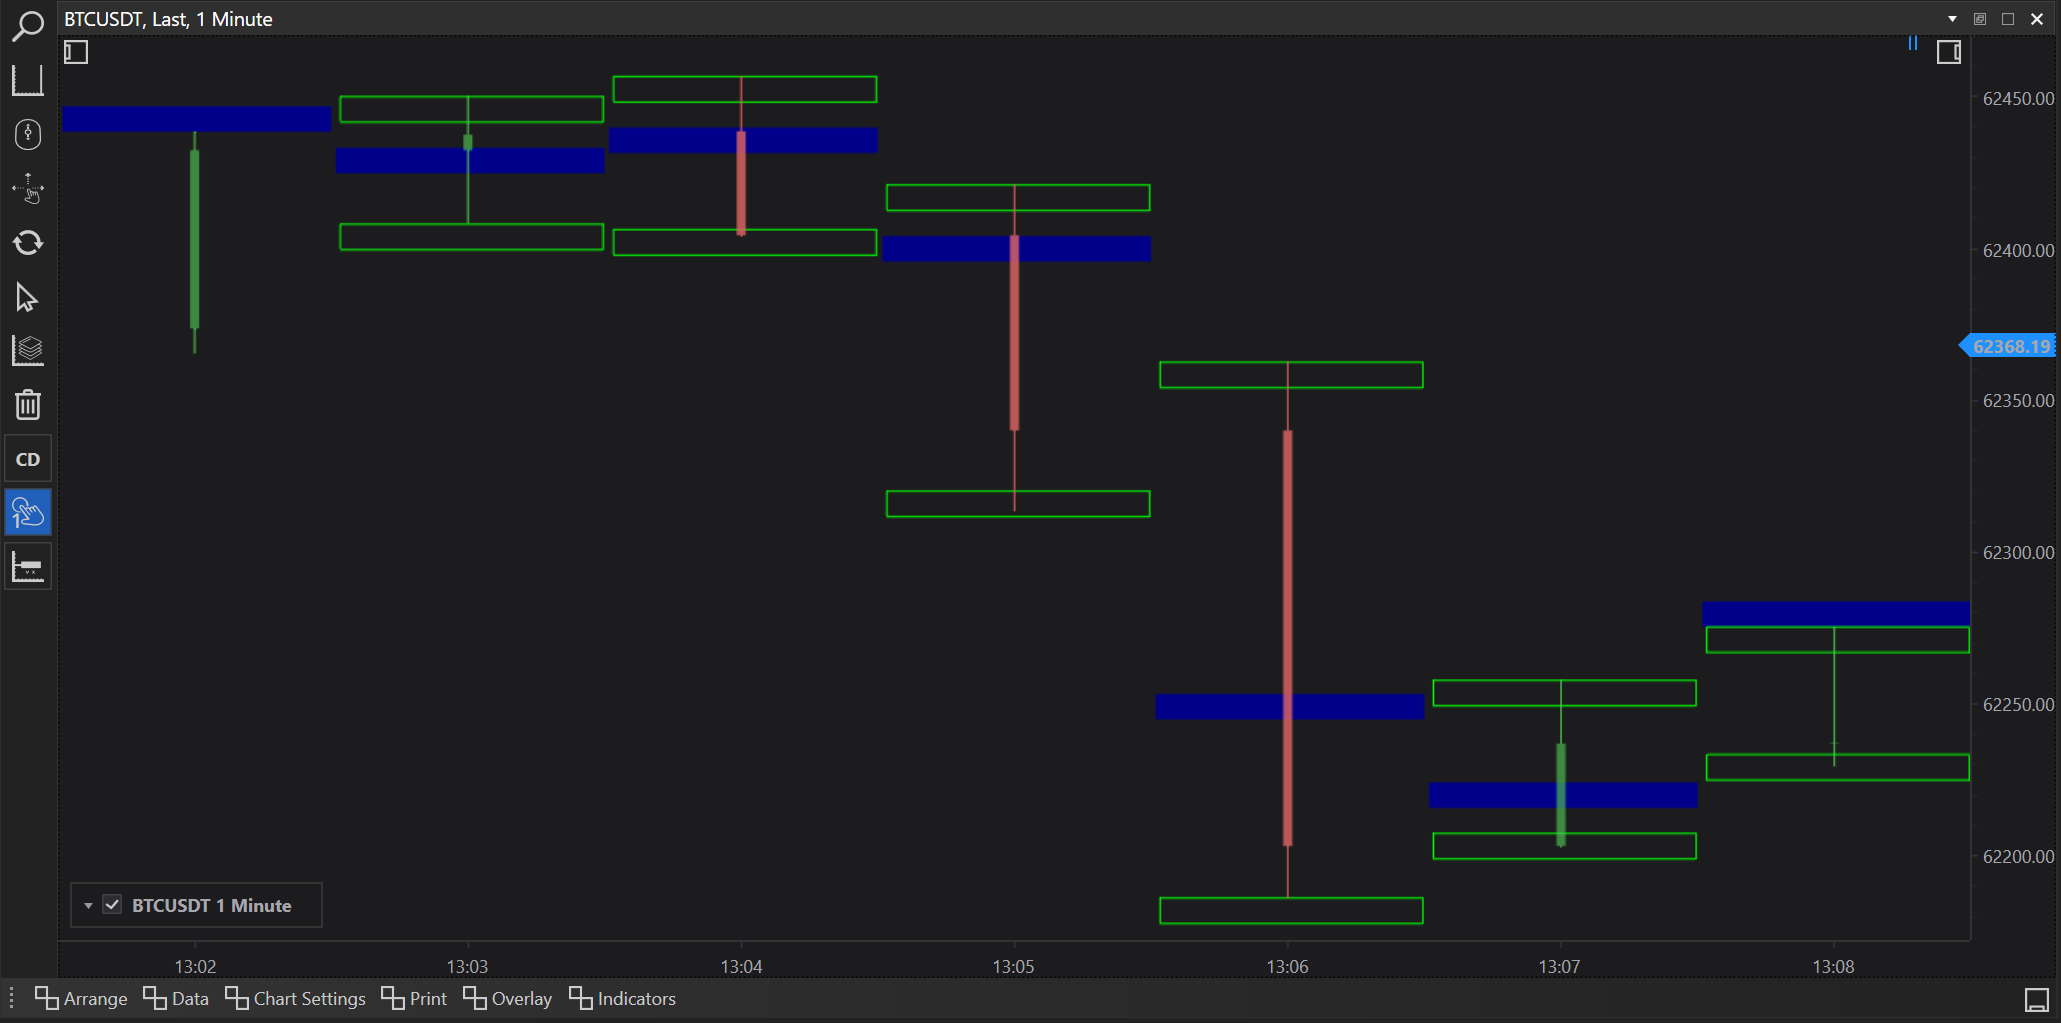
No Print
Description: This option keeps the candles clean, showing no additional data on them. It’s useful for traders who prefer a less cluttered chart and wish to focus solely on price movements without additional metrics.
Use Case: Ideal for an overview of the market without the distraction of volume or order flow details.
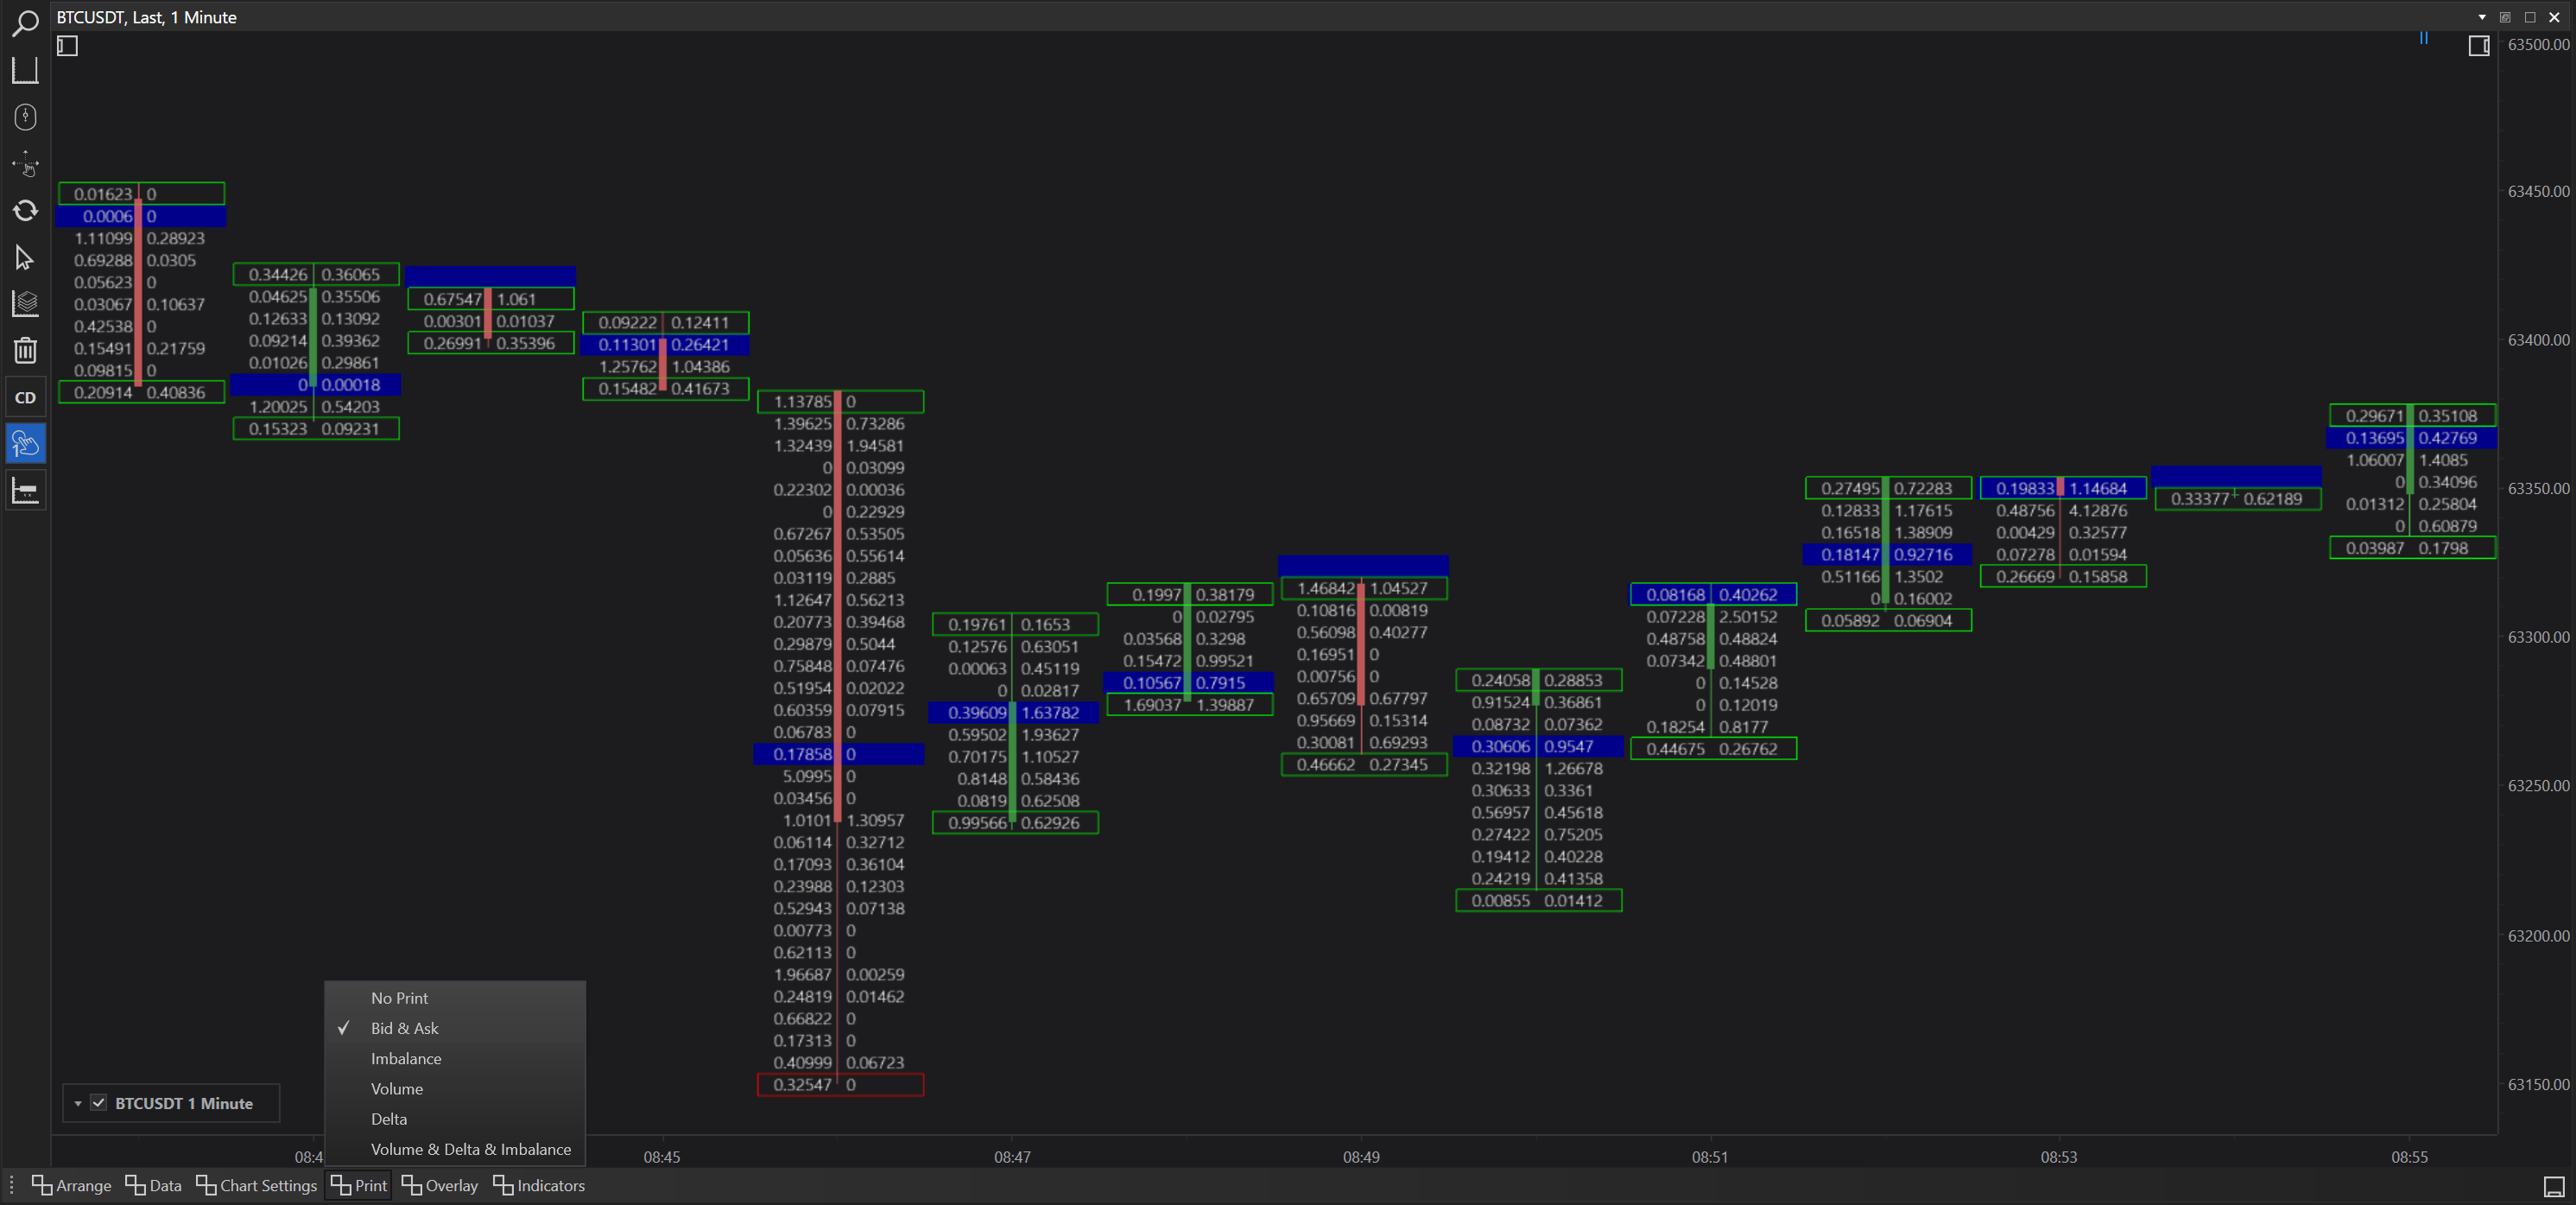
Bid & Ask
Description: Displays the number of bids and asks at each price level for each candle.
Use Case: Useful for identifying the demand and supply at different price points, helping traders gauge potential support and resistance levels.
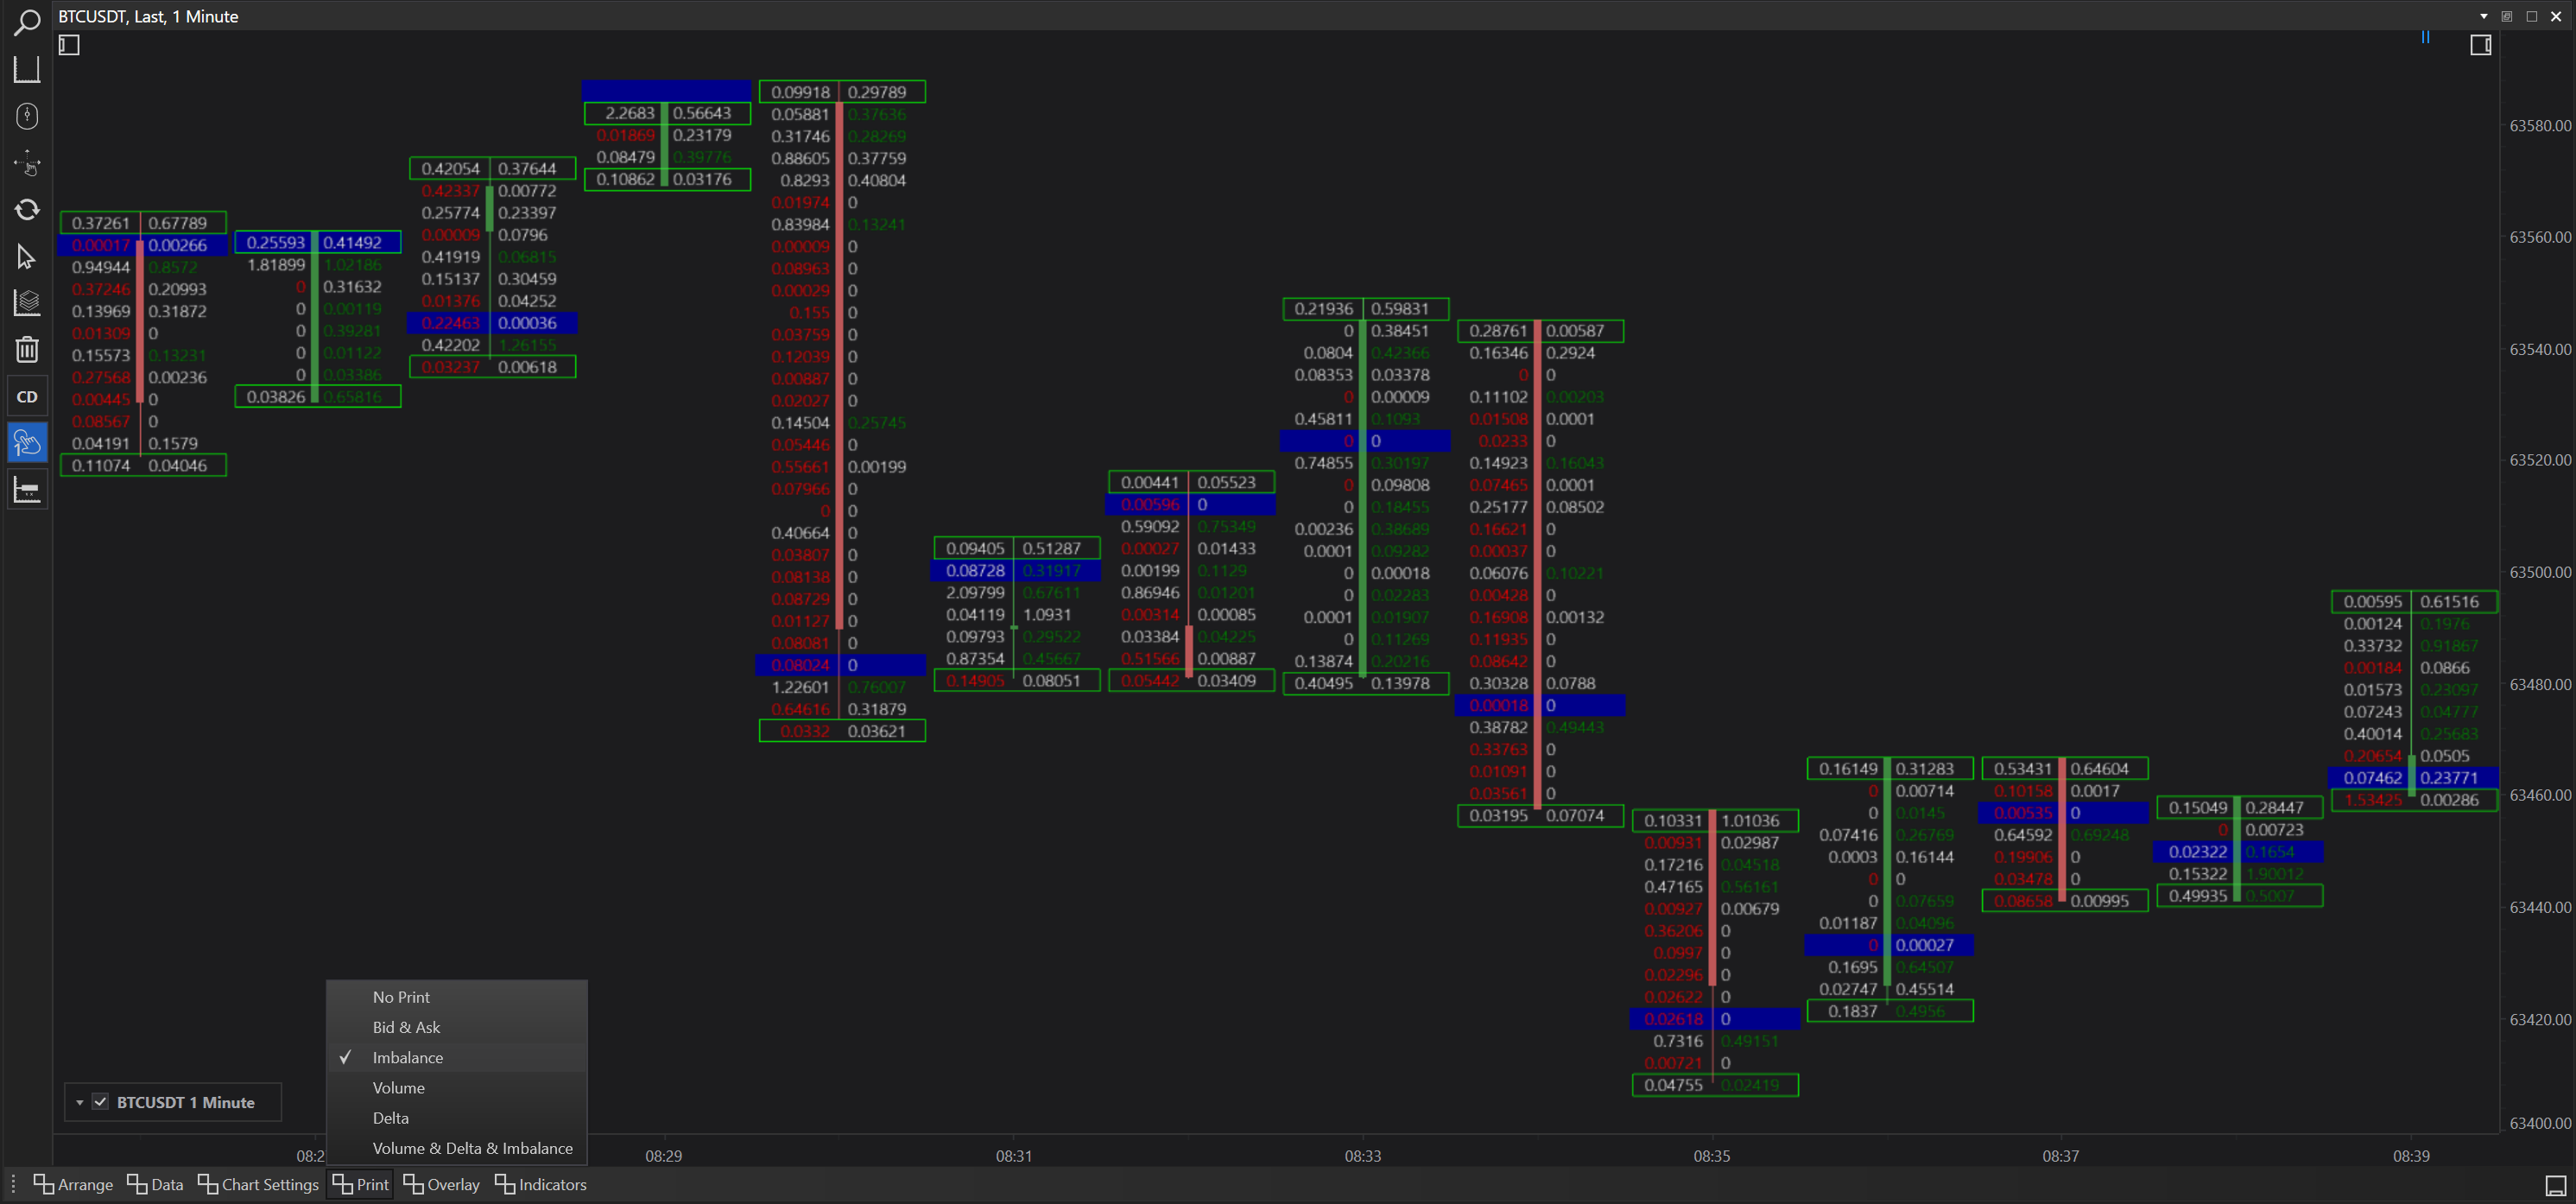
Imbalance
Description: Highlights areas where there is a significant imbalance between buyers and sellers.
Use Case: Can indicate potential reversals or continuation of trends, as large imbalances often precede shifts in market direction.
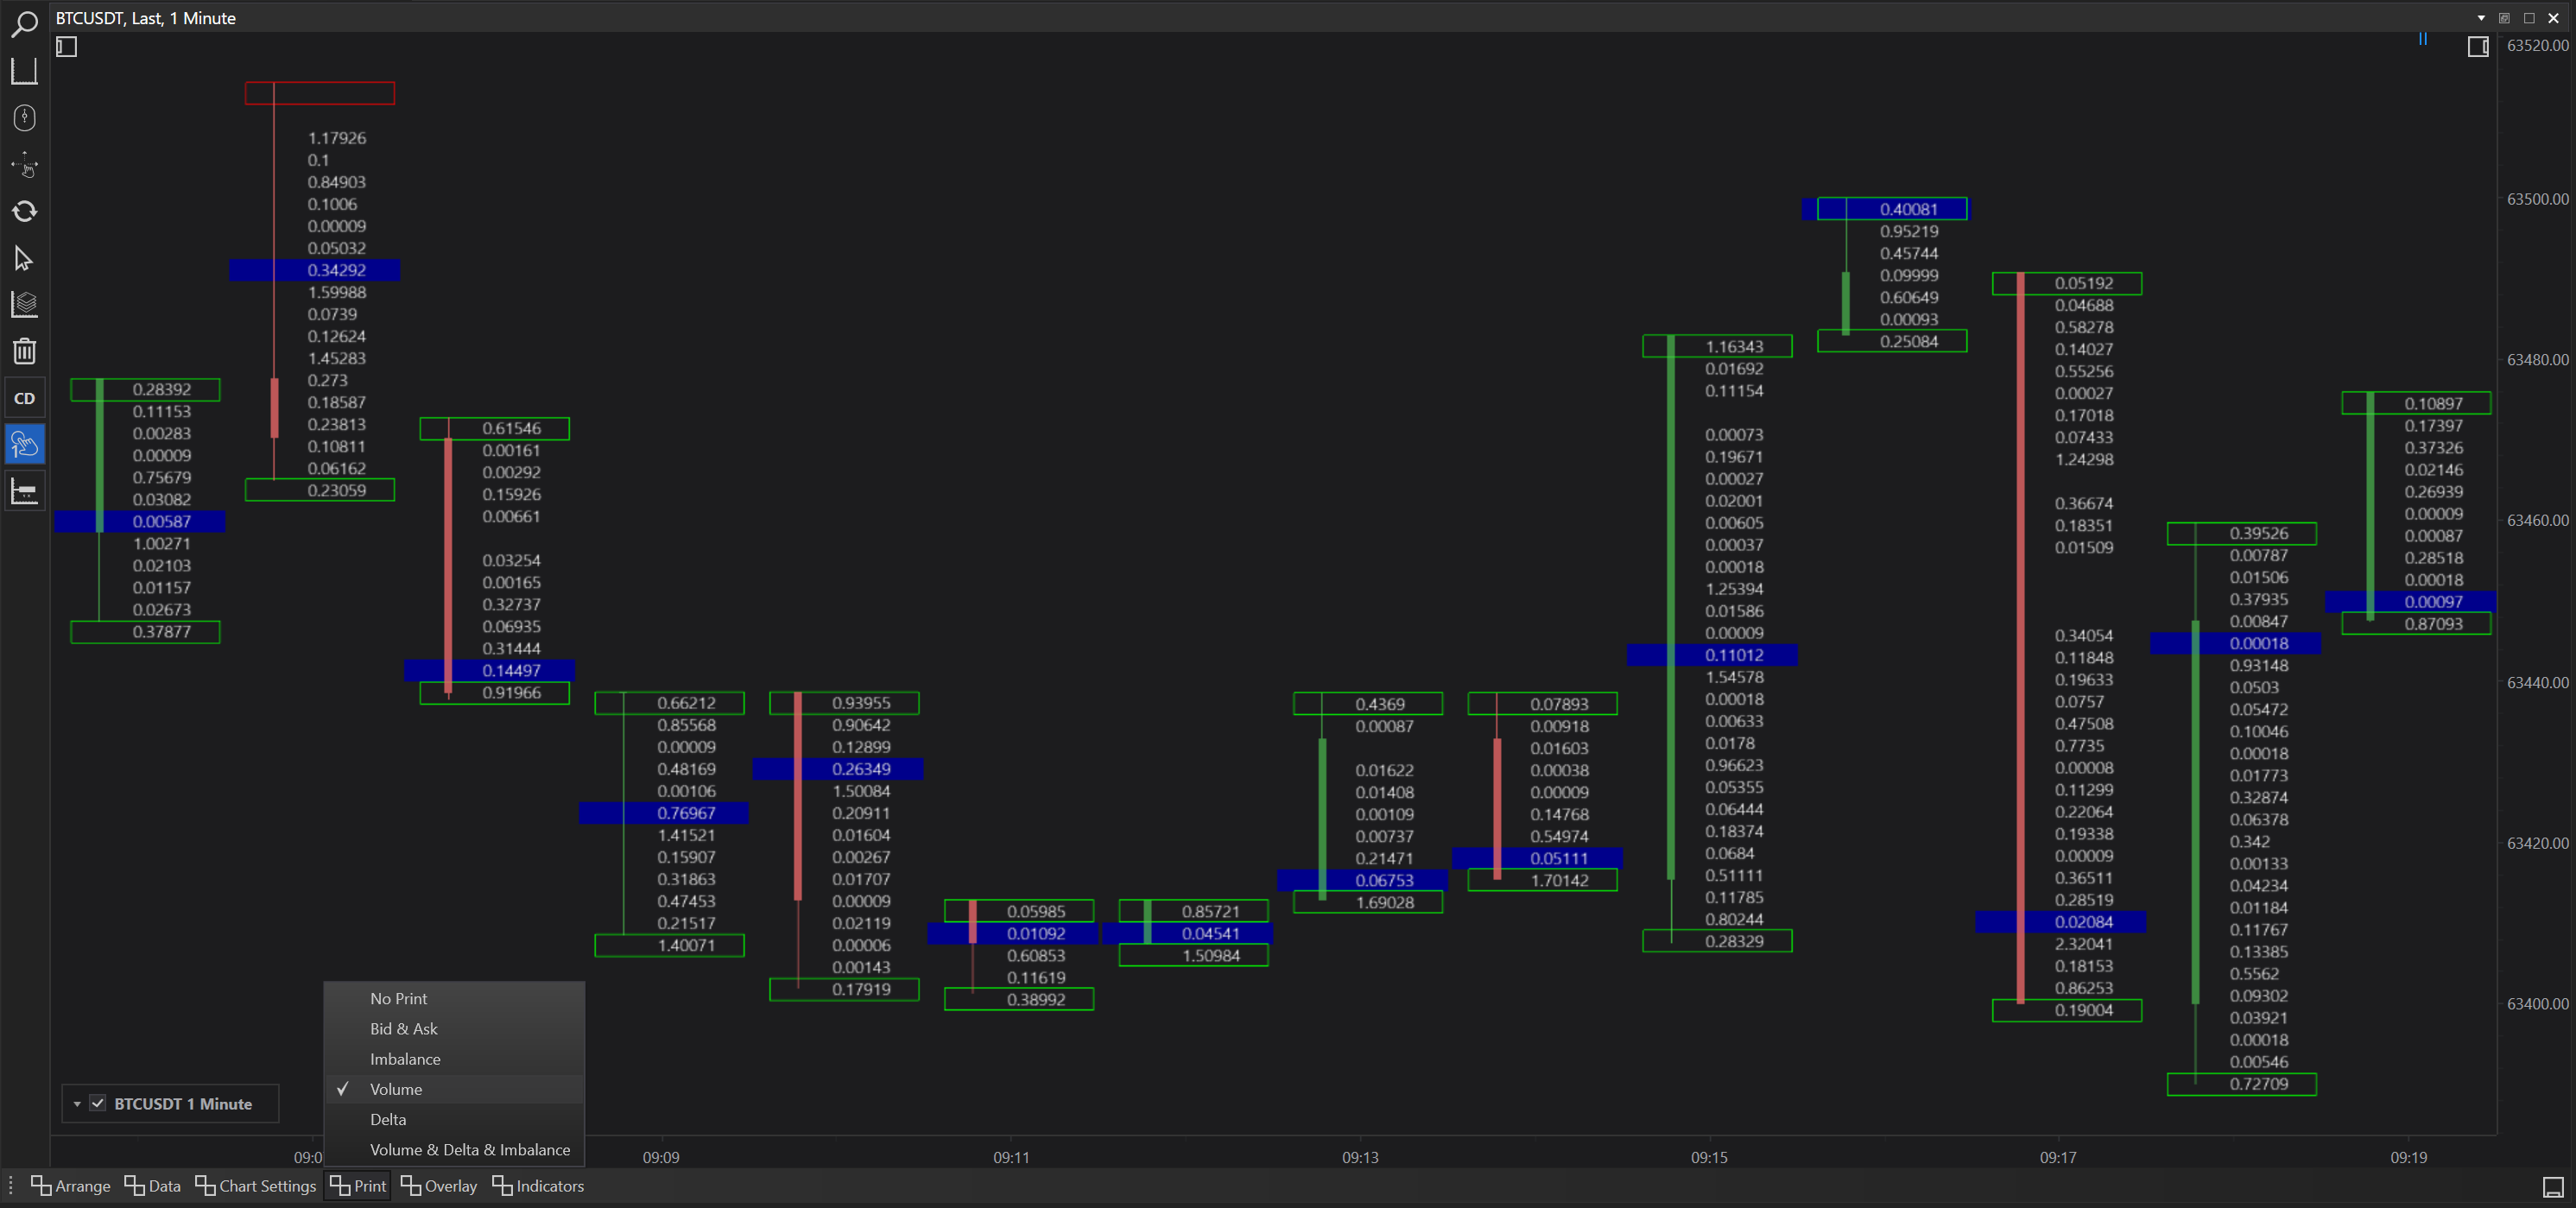
Volume
Description: Shows the total volume traded at each price level within the candle.
Use Case: Useful for spotting high-volume areas which may act as key levels for future price interactions.
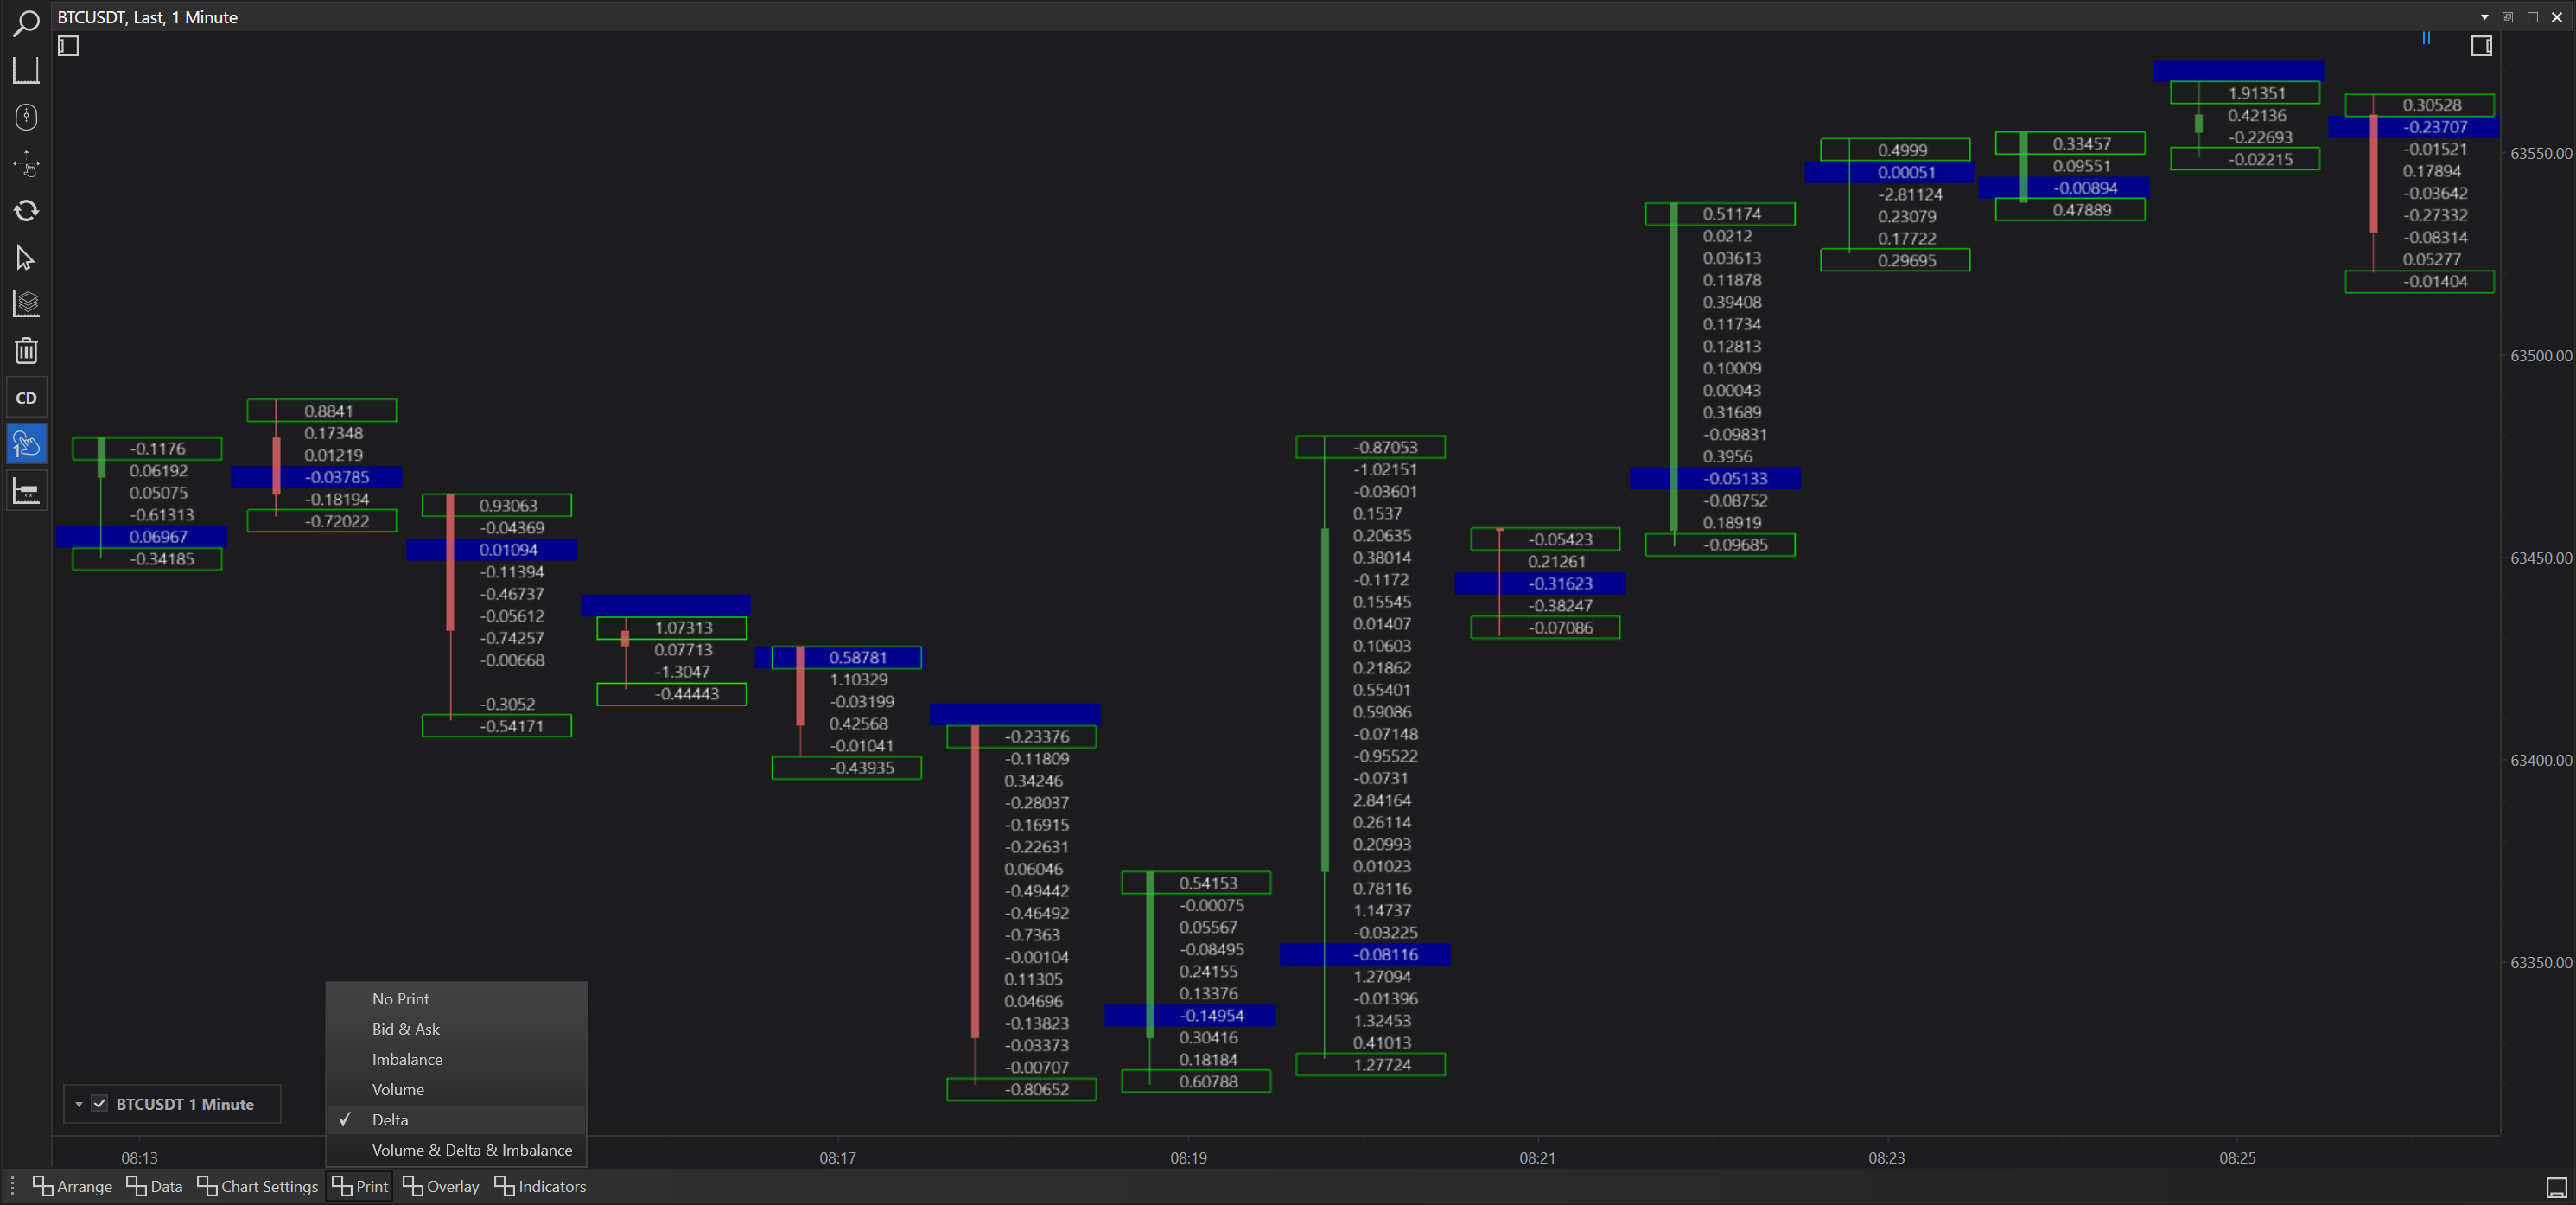
Delta
Description: Delta represents the net difference between buying and selling volume.
Use Case: A positive delta indicates buying pressure, while a negative delta suggests selling pressure, helping traders understand the dominant market force.
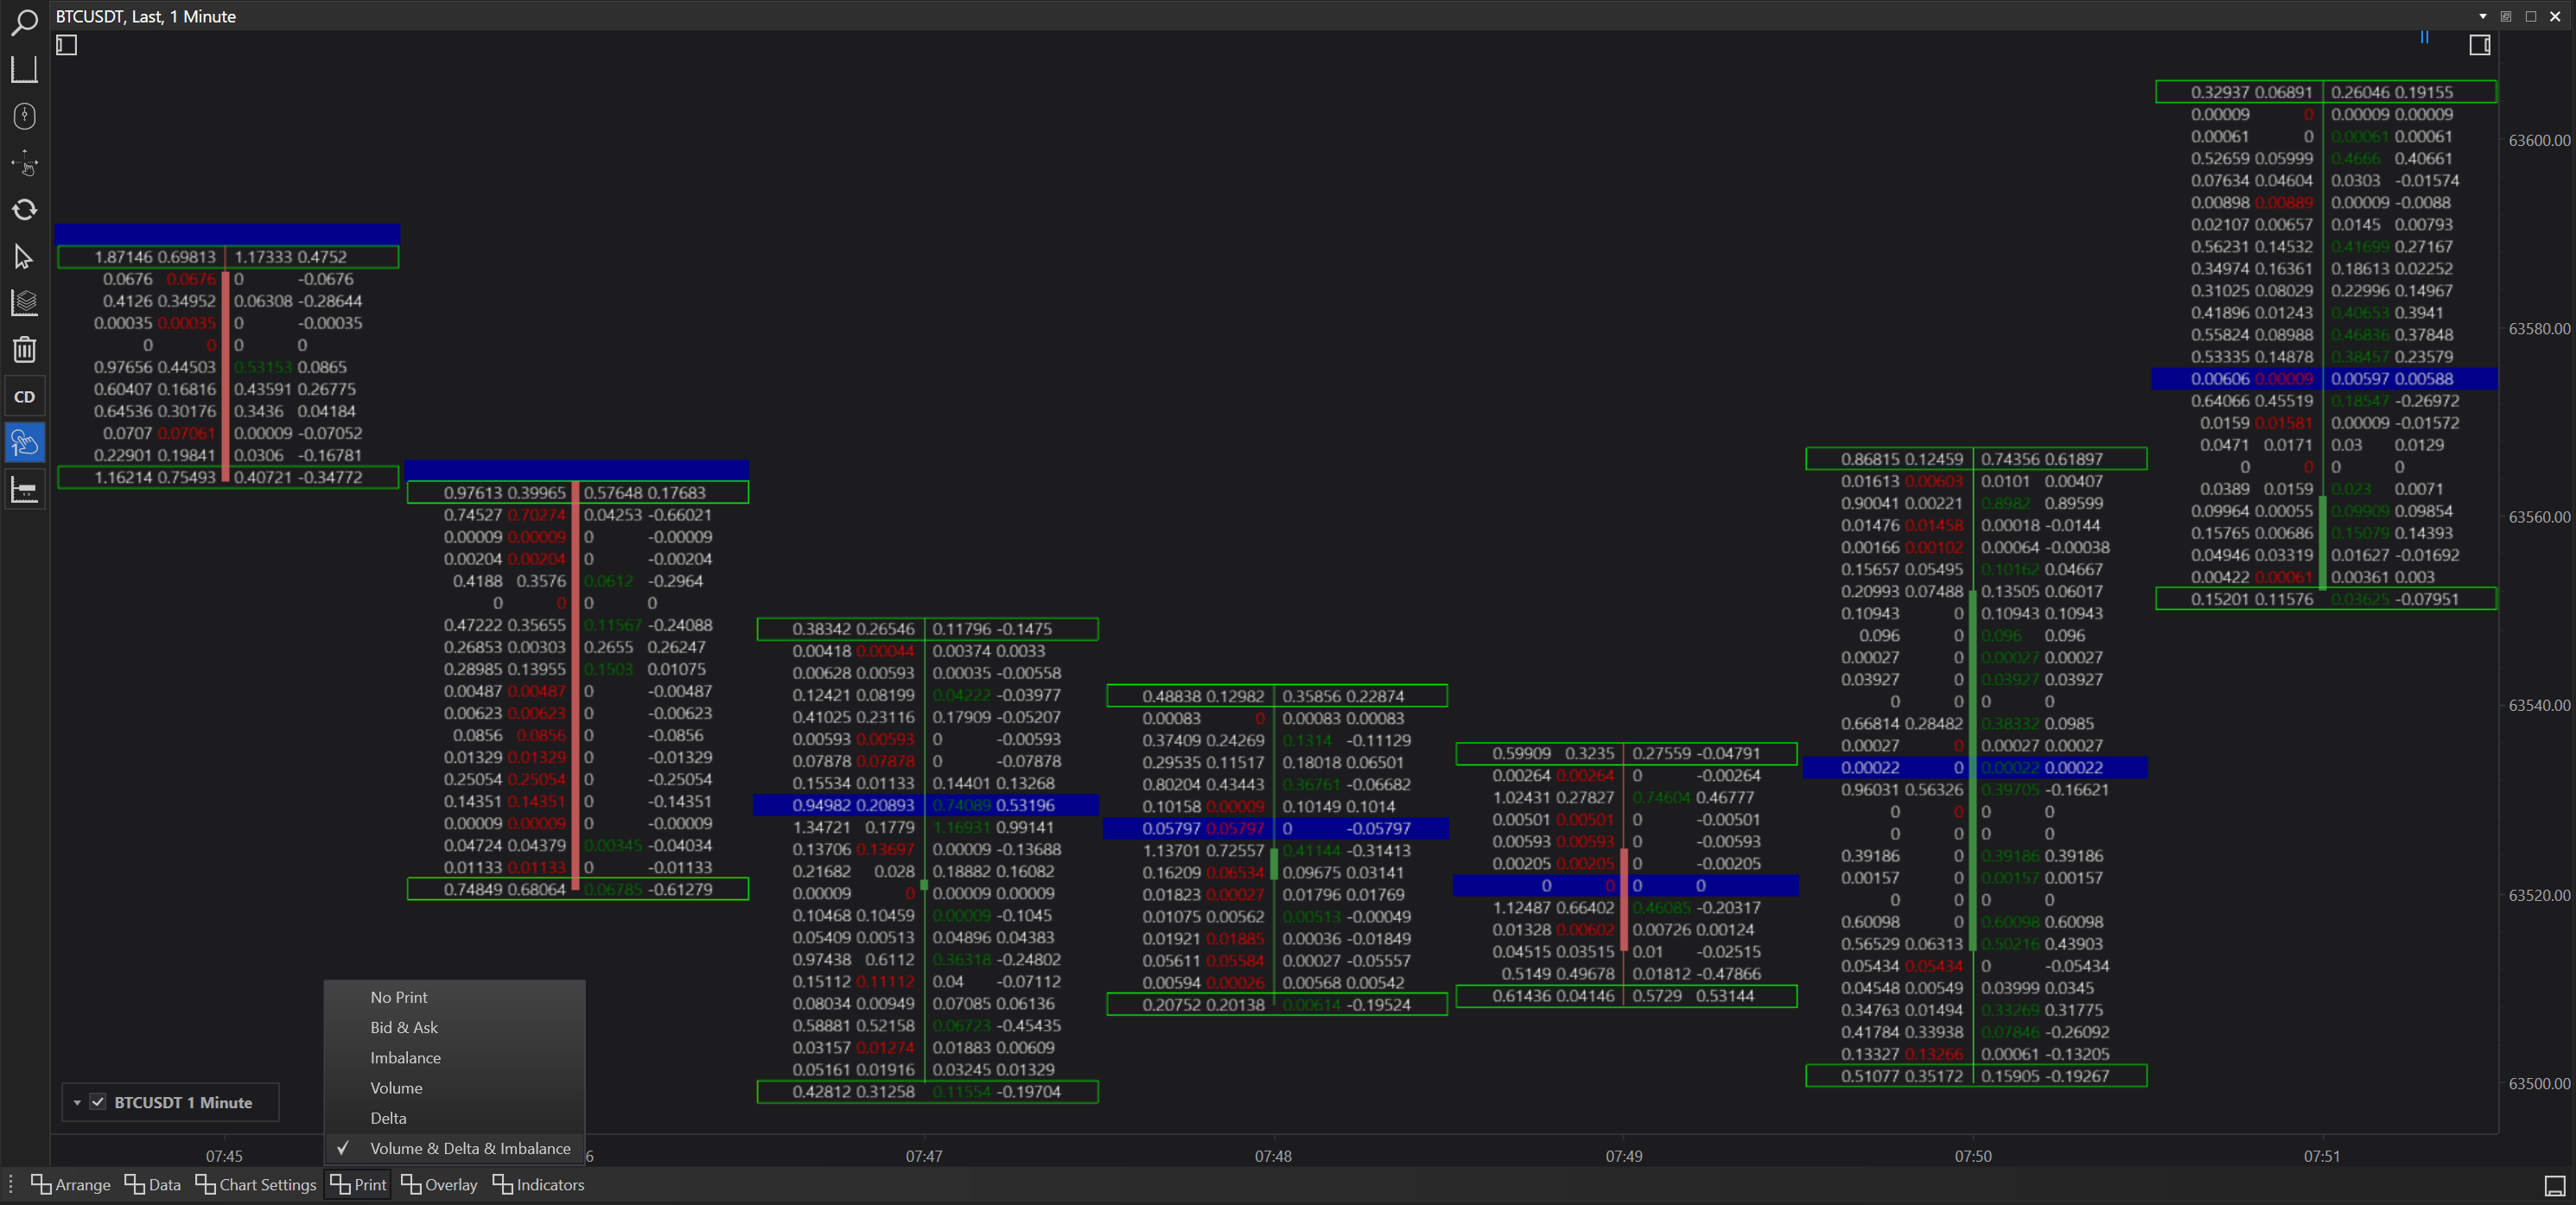
Volume & Delta & Imbalance
Description: Combines volume, delta, and imbalance data for a comprehensive view of market activity.
Use Case: This is the most detailed print option, providing a deep dive into market dynamics. It is particularly useful for advanced traders who base their strategies on intricate volume and order flow analysis.
How to Leverage Print Options Effectively
-
Strategic Planning: By choosing the appropriate print option, traders can align their analysis with their trading strategies. For example, a focus on imbalances might be more suitable for those looking for reversal opportunities, while volume data might benefit a trader looking for breakout confirmation.
-
Risk Management: Understanding where large volumes are traded or where significant imbalances occur can help in setting more precise stop-loss or take-profit levels.
-
Enhanced Analysis: Using multiple print options over time can help traders develop a more nuanced understanding of how different factors affect price movements in their particular markets.
Conclusion
The print options available in FinStudio's Cluster charts equip traders with the tools to tailor their charting to exactly what they need to see, blending visual simplicity with data richness. Whether focusing on basic price action or incorporating complex order flow data, these options enhance the charting experience, making it possible to approach the market with well-informed confidence.