Combining Prints and Overlays
FinStudio’s Cluster Charts offer robust customization capabilities that allow users to combine different "prints" and "overlays" for enhanced market analysis. This flexibility enables traders to tailor their charts to display specific data in ways that best suit their trading strategies and market understanding.
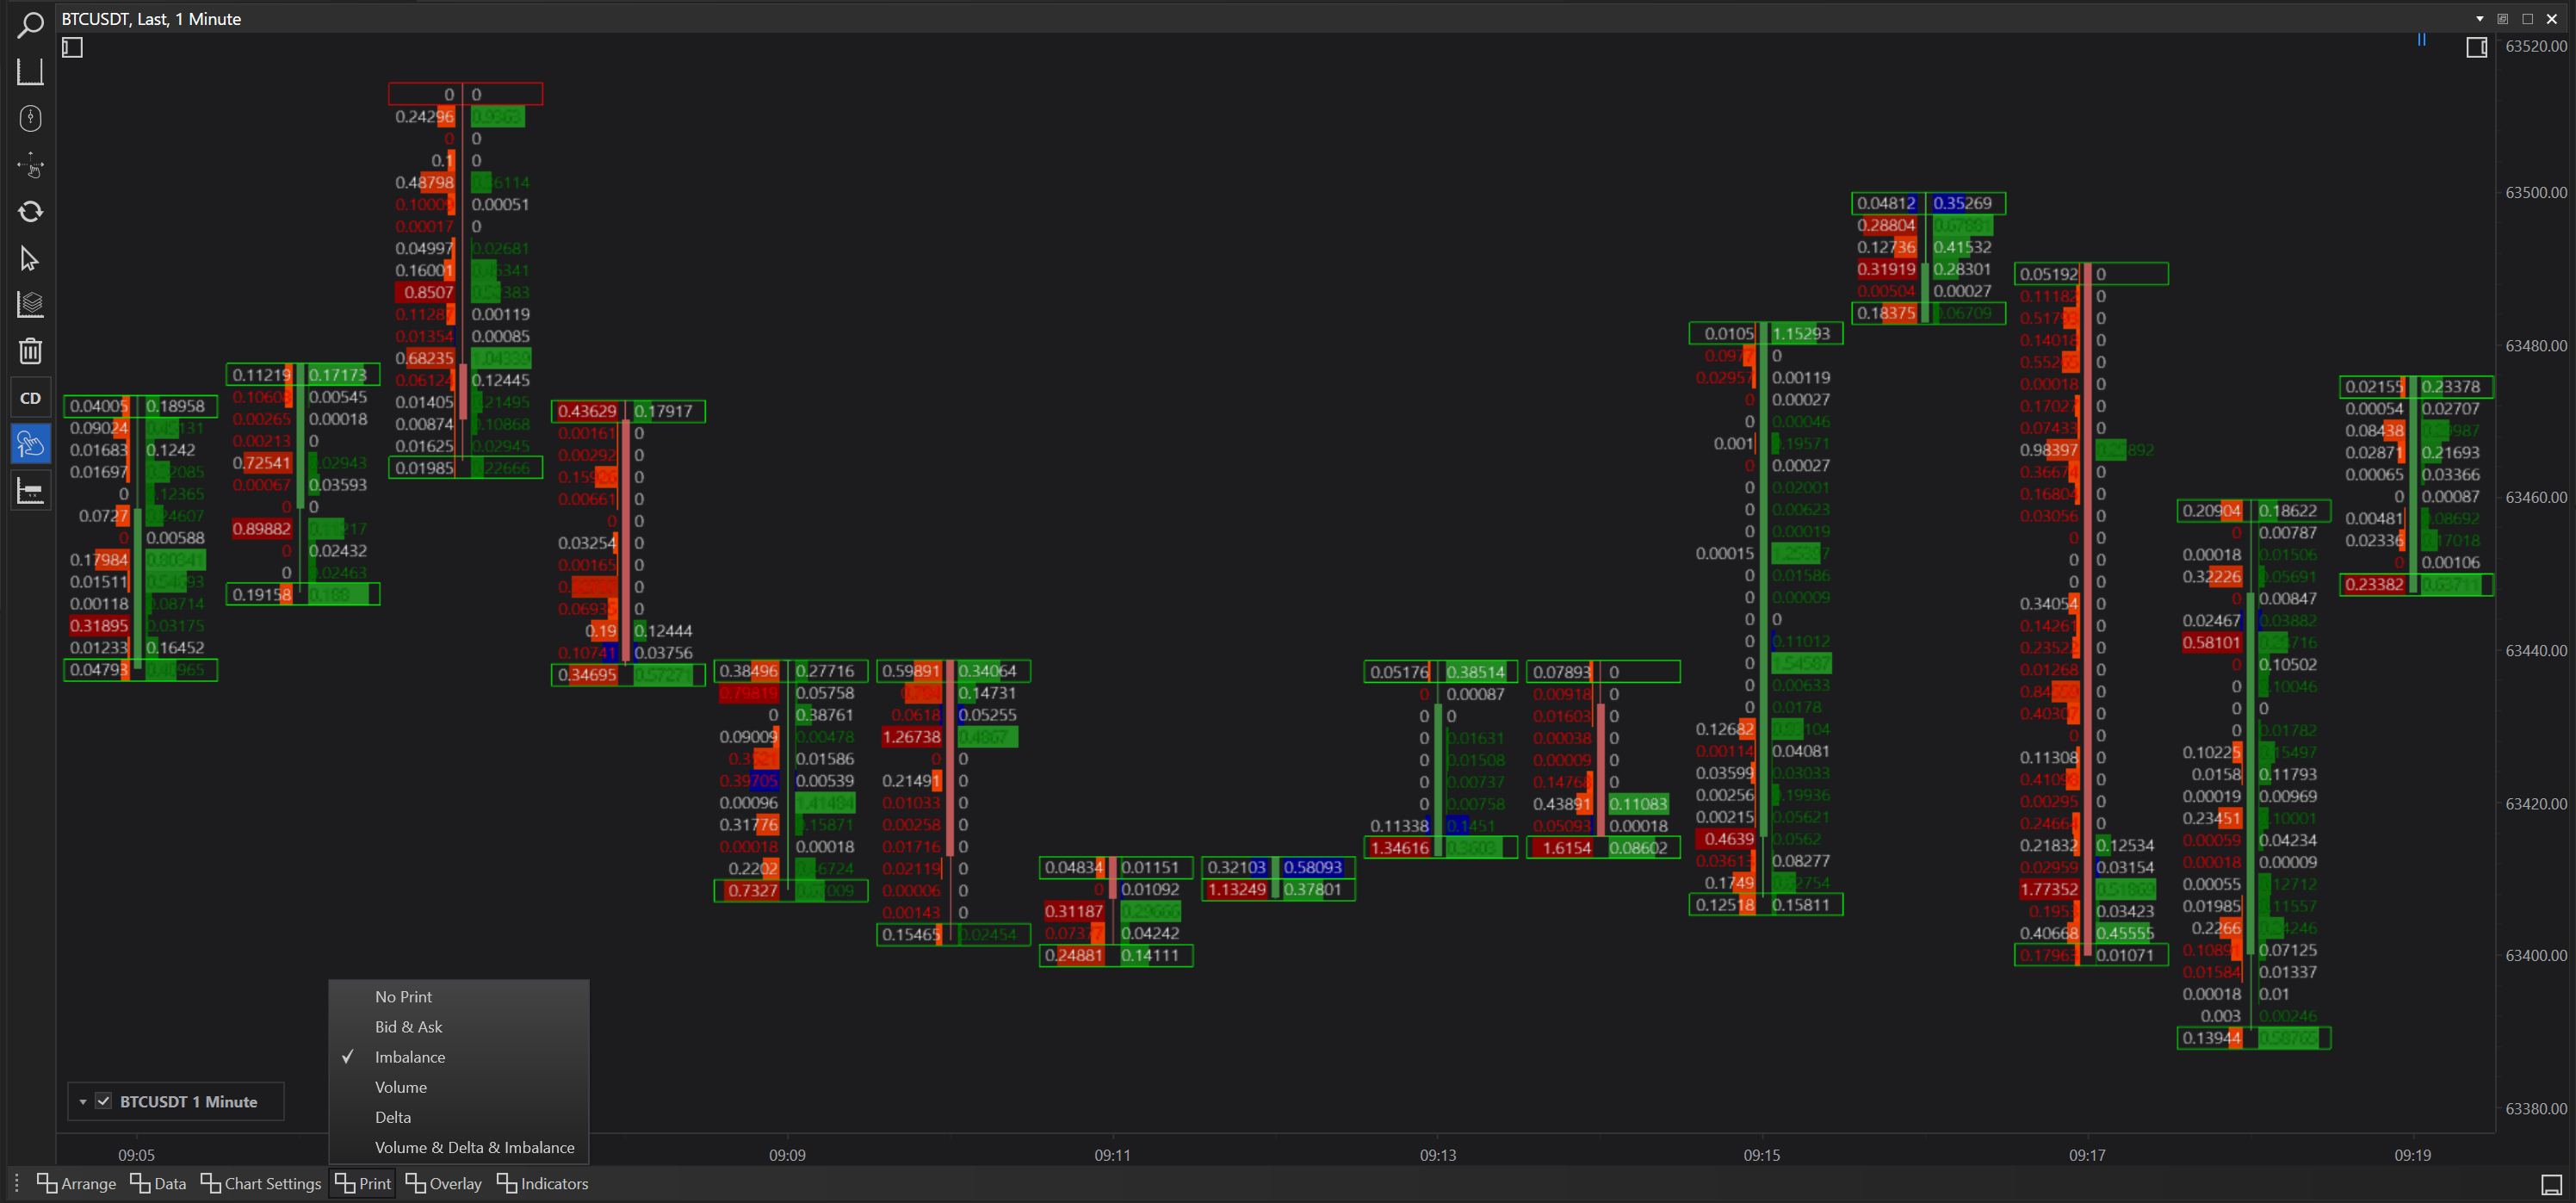
Print Options
Prints in cluster charts refer to the type of data visualized directly on the chart's candles or bars. These prints can provide detailed insights into various aspects of trading activity within each bar. The available prints in FinStudio include:
- No Print: A clean view without additional data on the bars, focusing solely on price movements.
- Bid & Ask: Shows the volume of bids versus asks, highlighting market sentiment and potential pressure points.
- Imbalance: Identifies areas where there is a significant imbalance between buys and sells, which can indicate potential reversal points or continuation of trends.
- Volume: Displays the total volume traded at each price point within a bar, offering insights into the strength of price movements.
- Delta: Visualizes the difference in volume between buys and sells, giving a clear indication of bullish or bearish momentum.
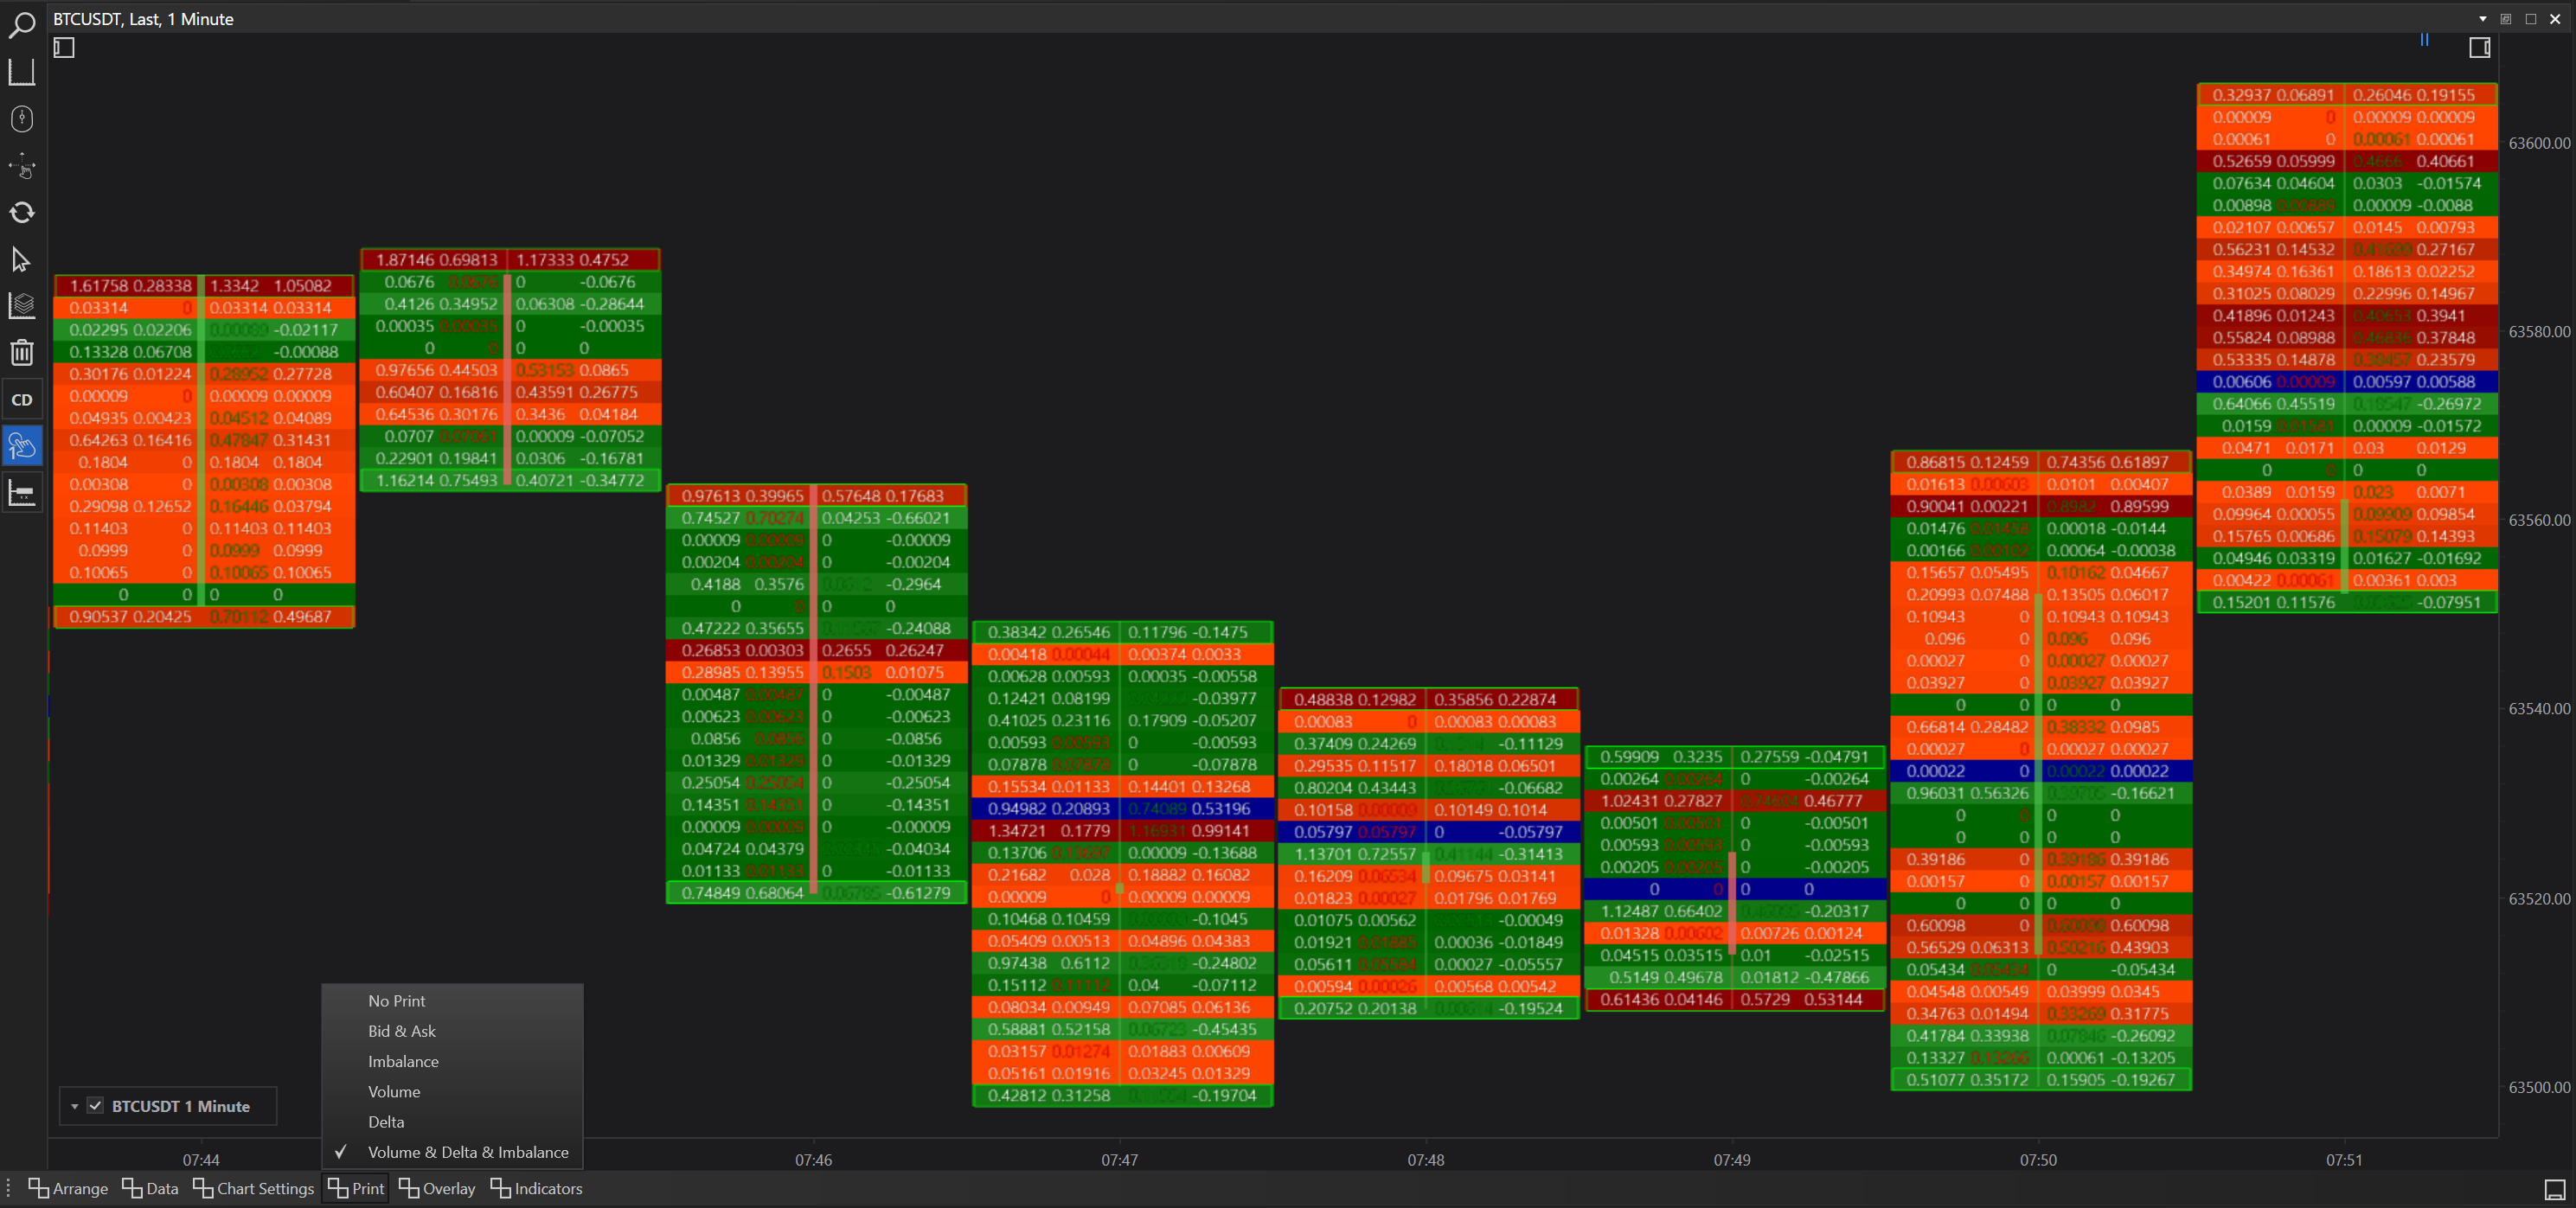
- Volume, Delta, & Imbalance: A comprehensive view that combines volume data, delta statistics, and imbalances all in one print, providing a multi-dimensional analysis of market activity.
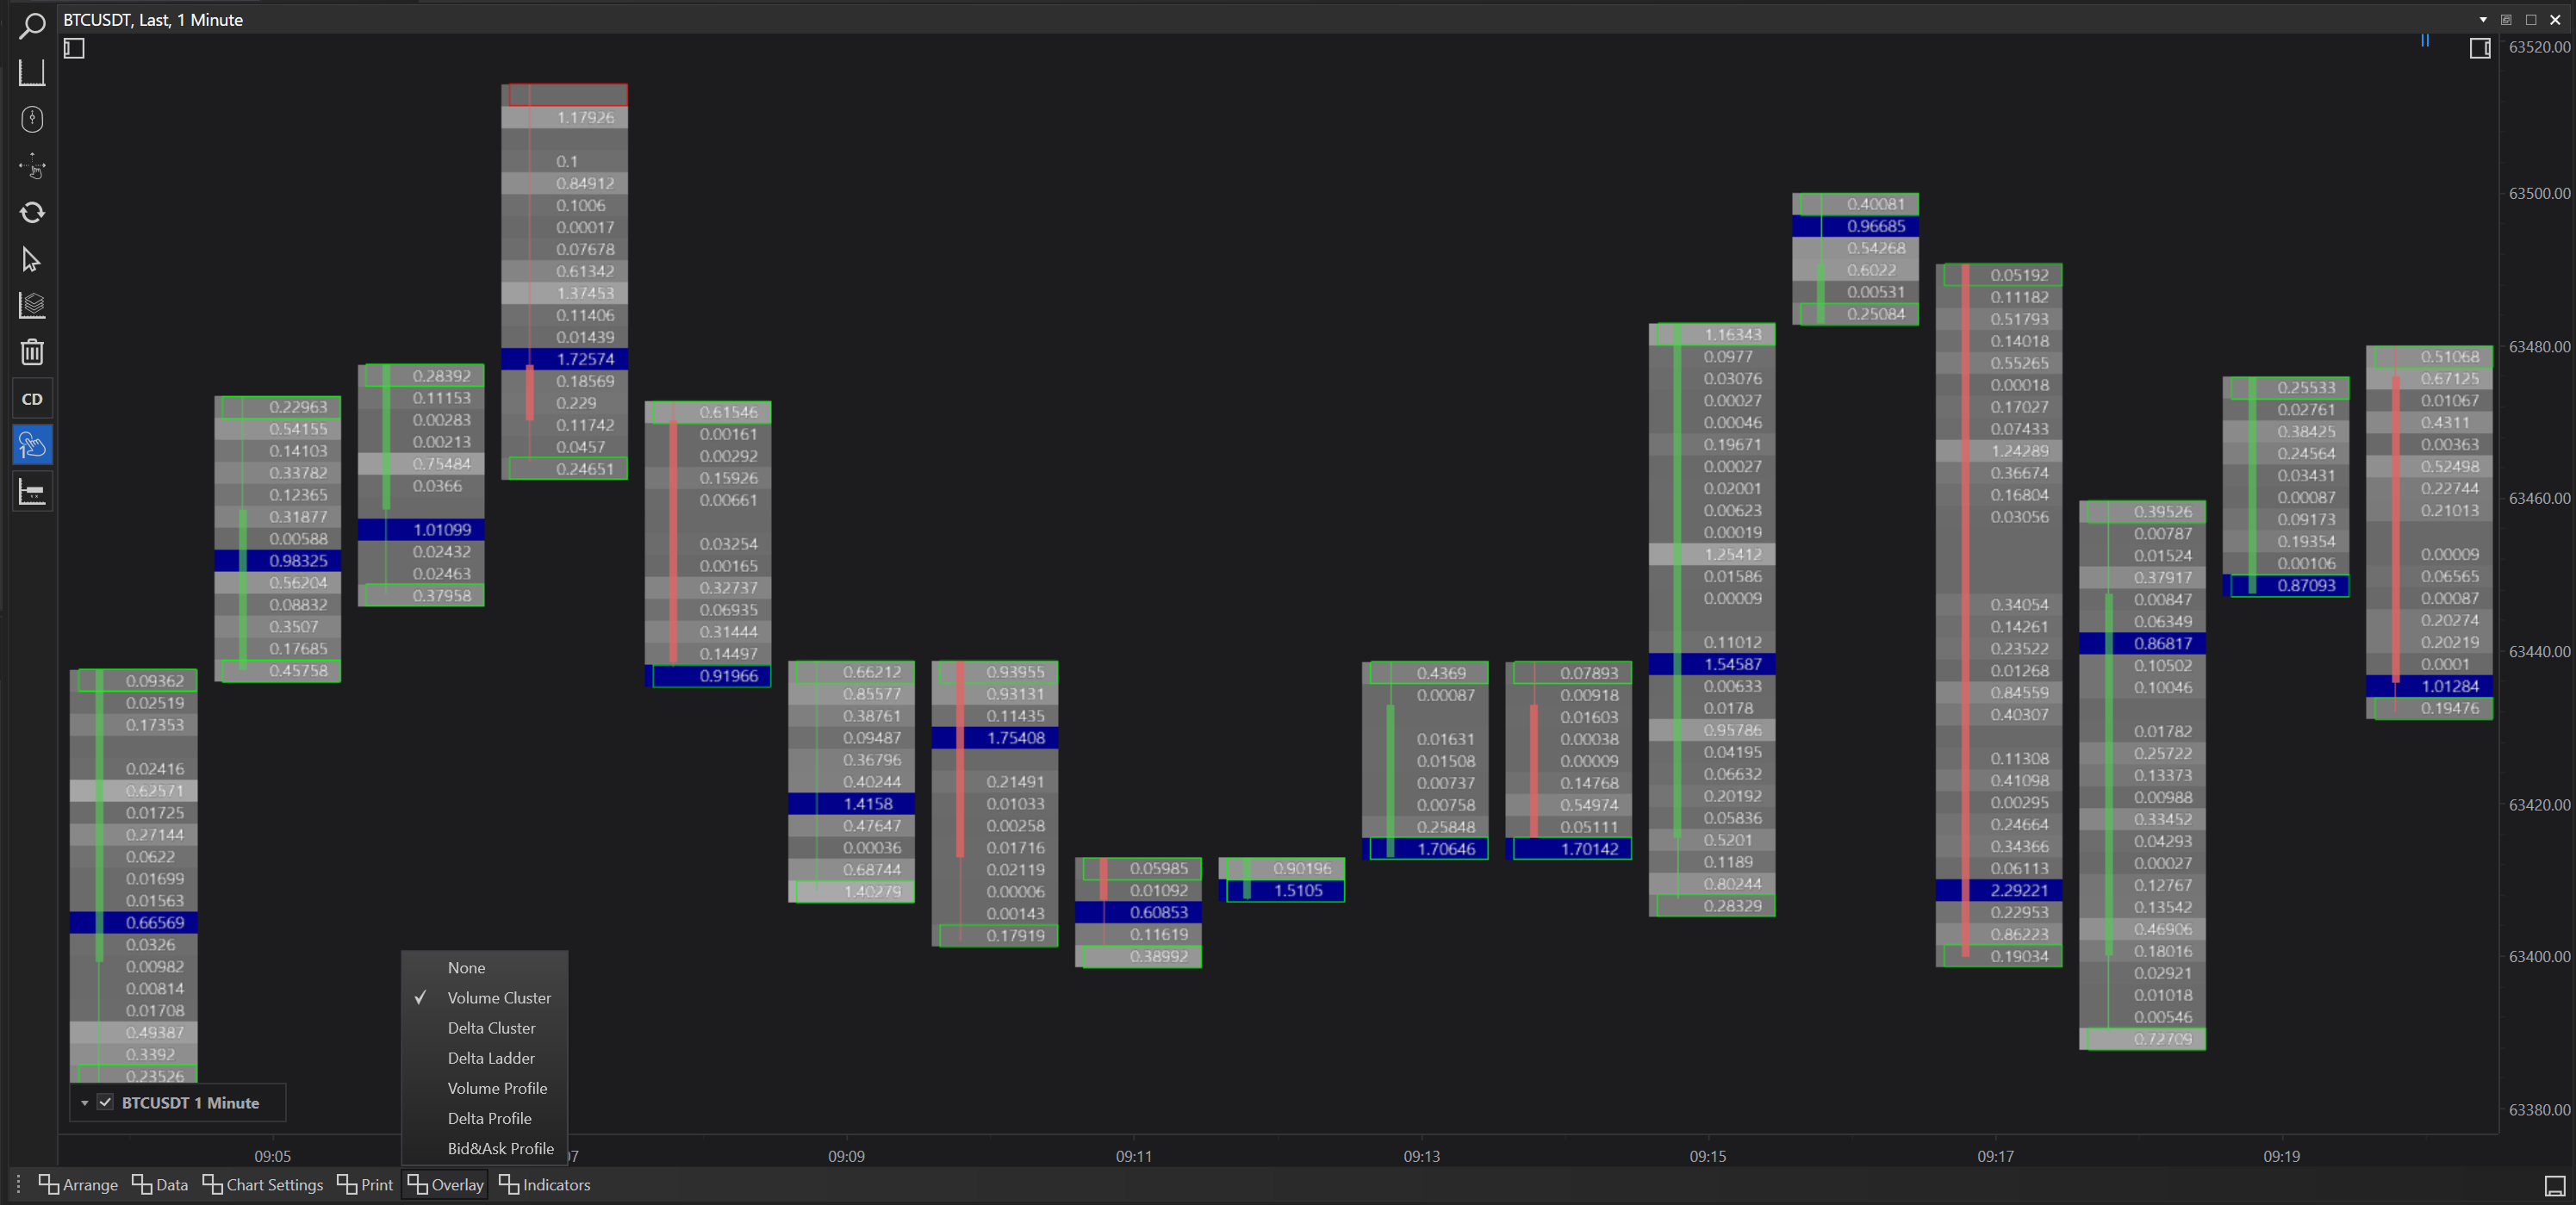
Overlay Options
Overlays add additional layers of information on top of the base chart, which can be used to analyze market depth and liquidity among other factors. The overlays available in FinStudio enhance the depth of analysis by integrating with the prints. Options include:
- None: No overlay, allowing the prints to stand out more clearly.
- Volume Cluster: Groups trades by volume at specific price levels, useful for identifying support and resistance levels based on trading volume.
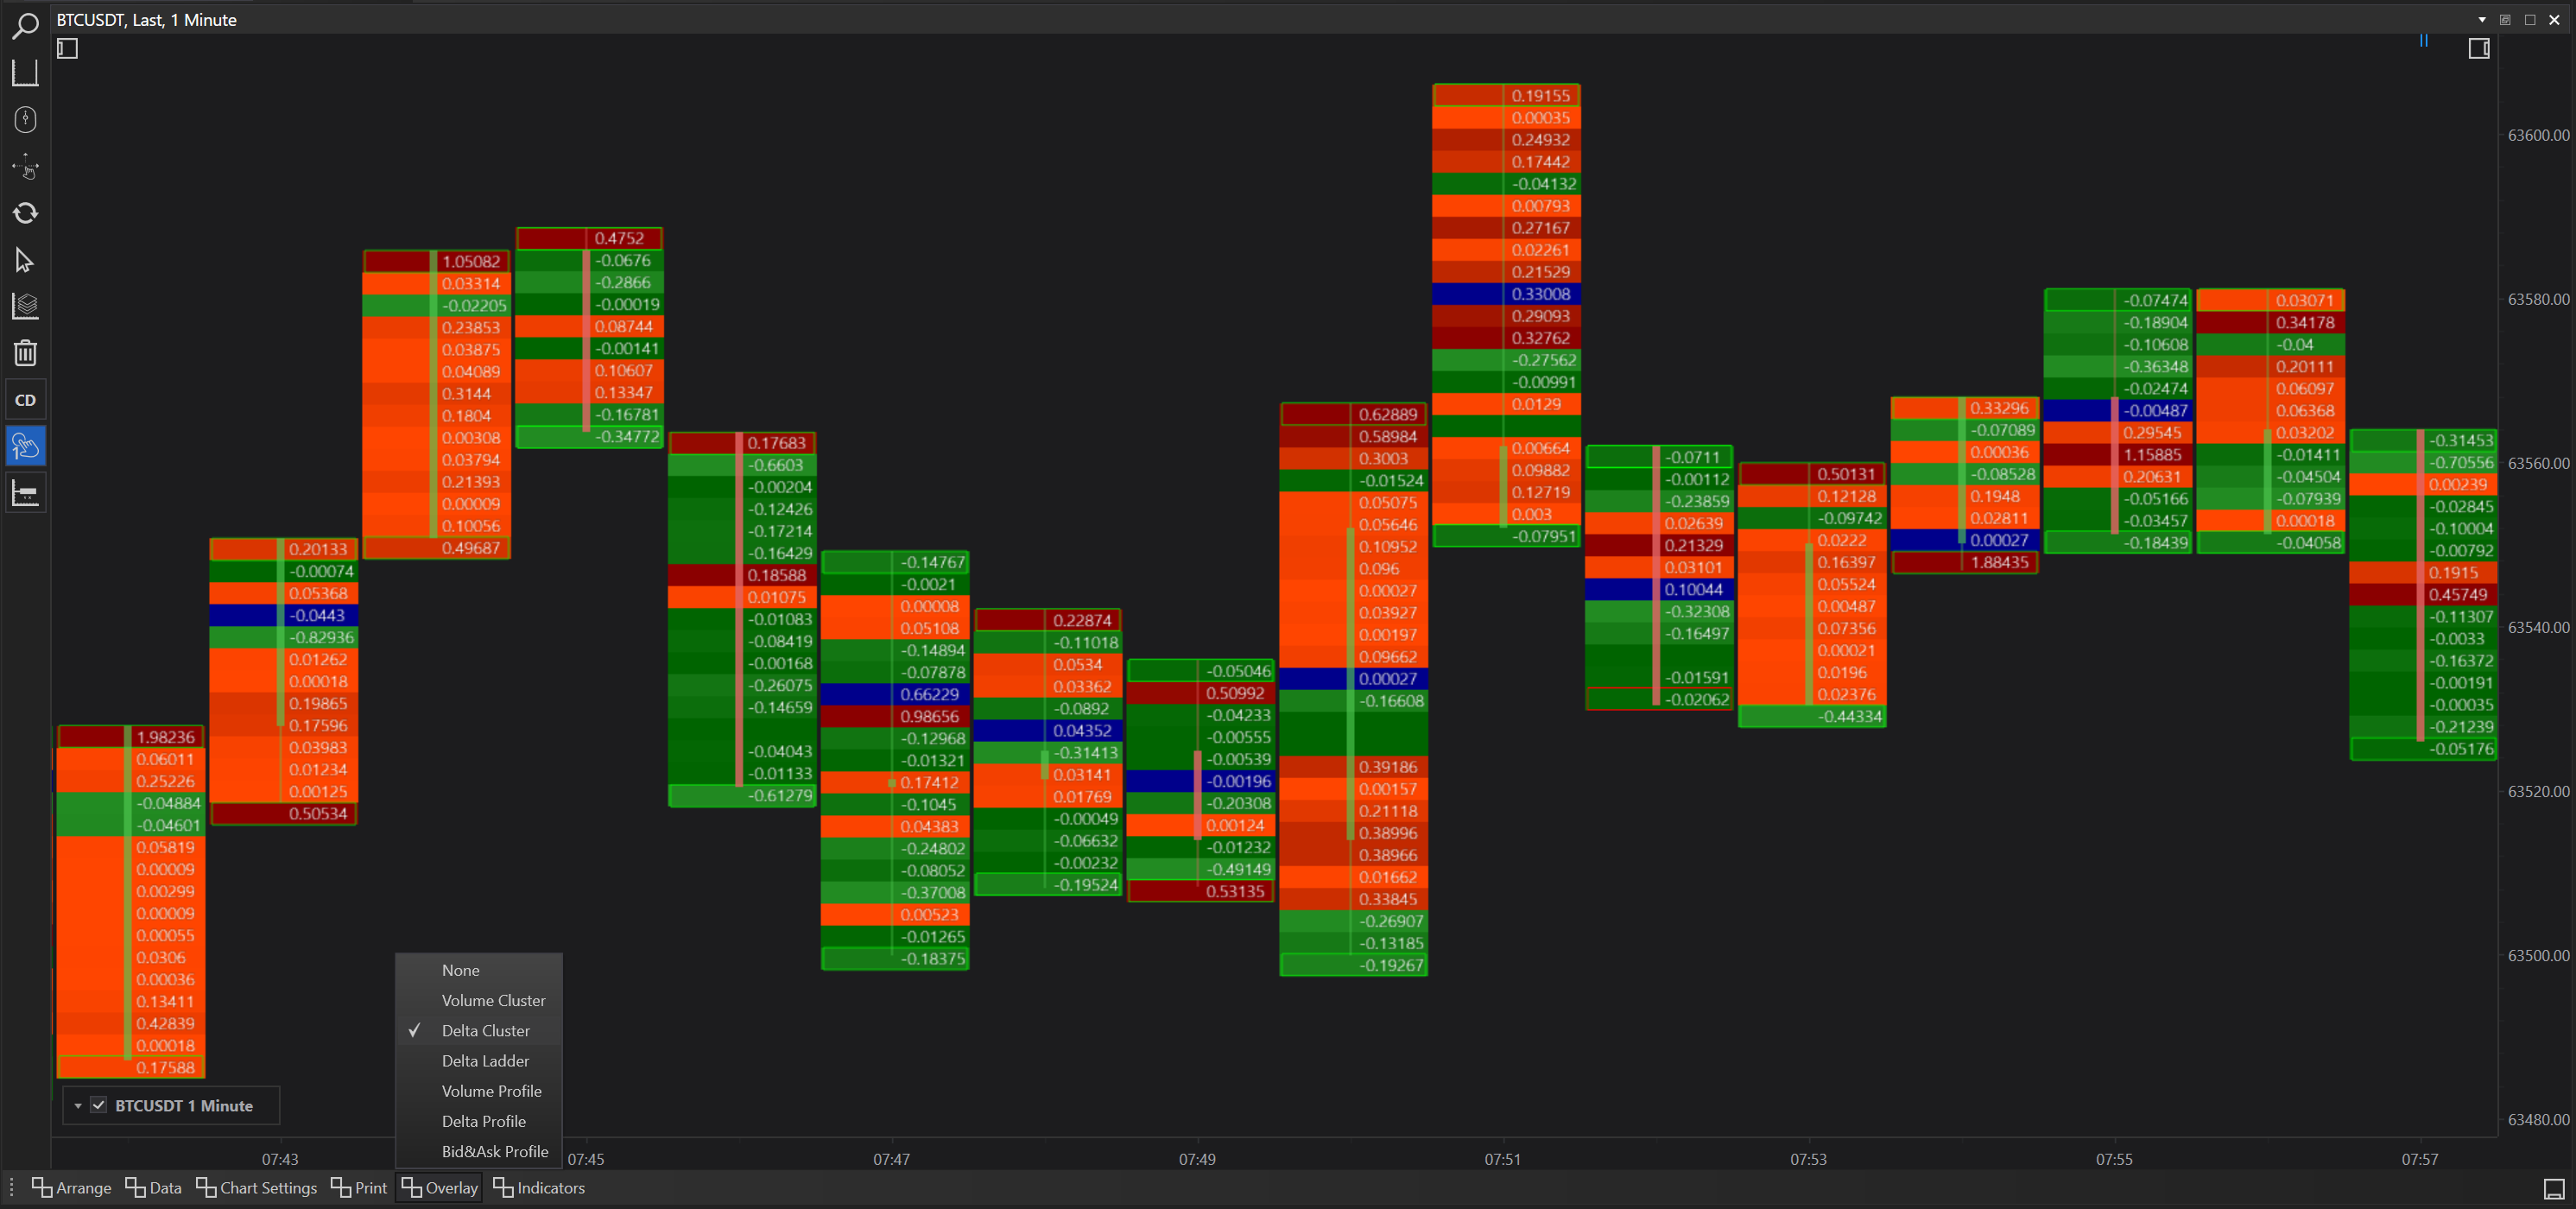
- Delta Cluster: Aggregates the deltas at various price levels to show where buying or selling pressure was most intense.
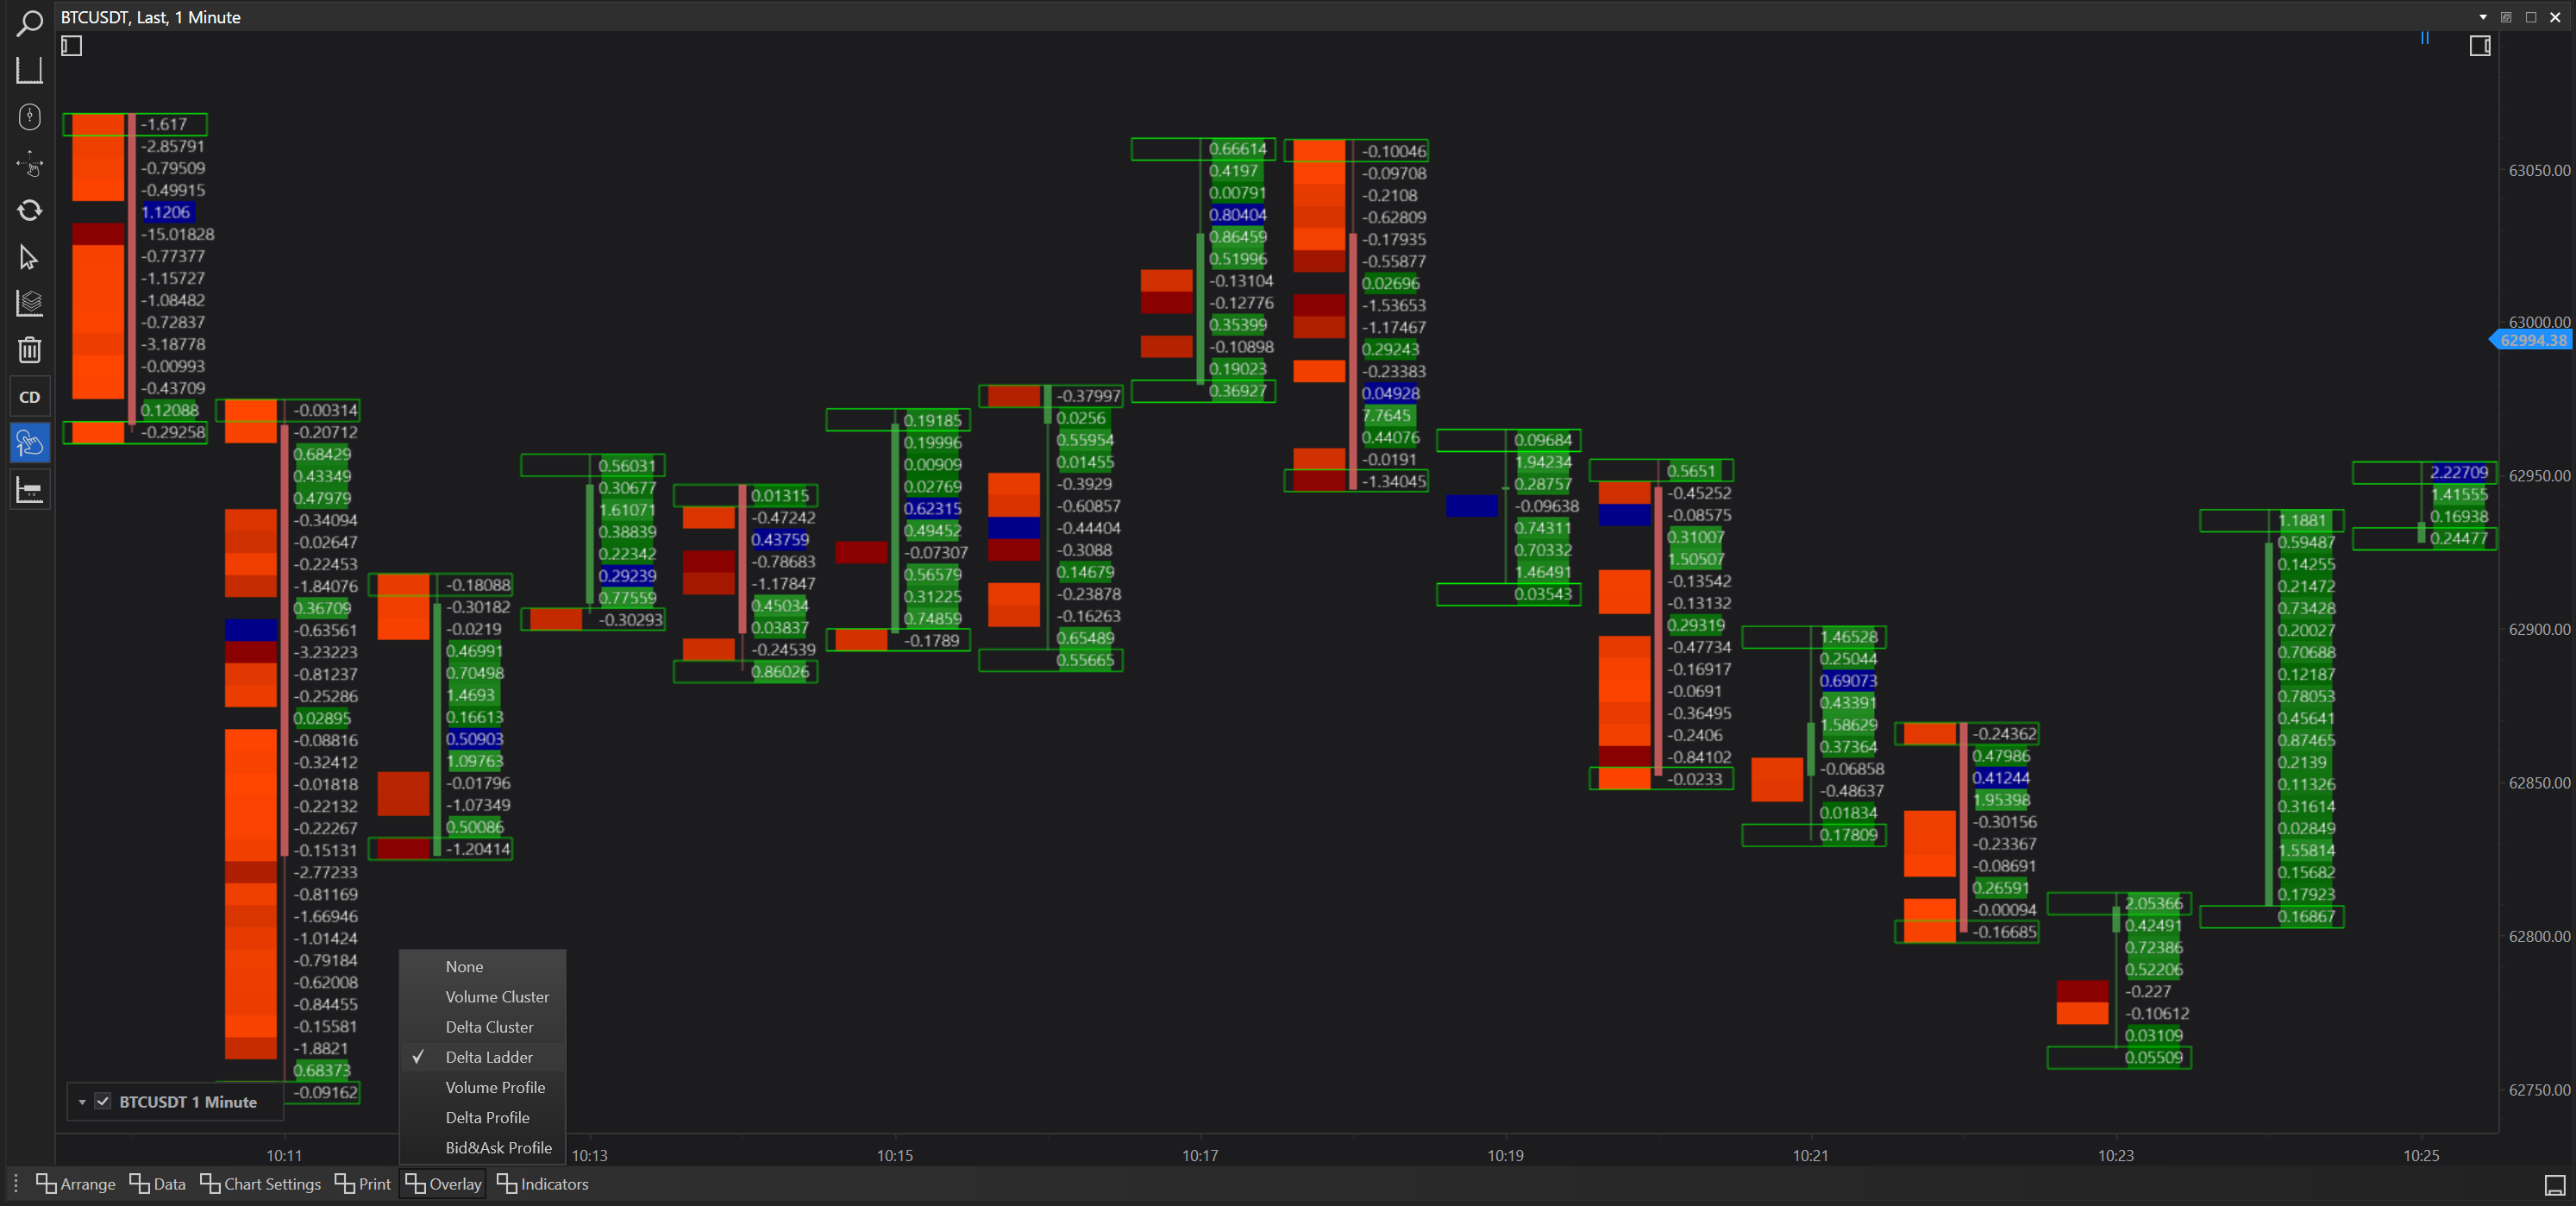
- Delta Ladder: Provides a step-by-step view of how delta changes across price levels, offering insights into momentum shifts.
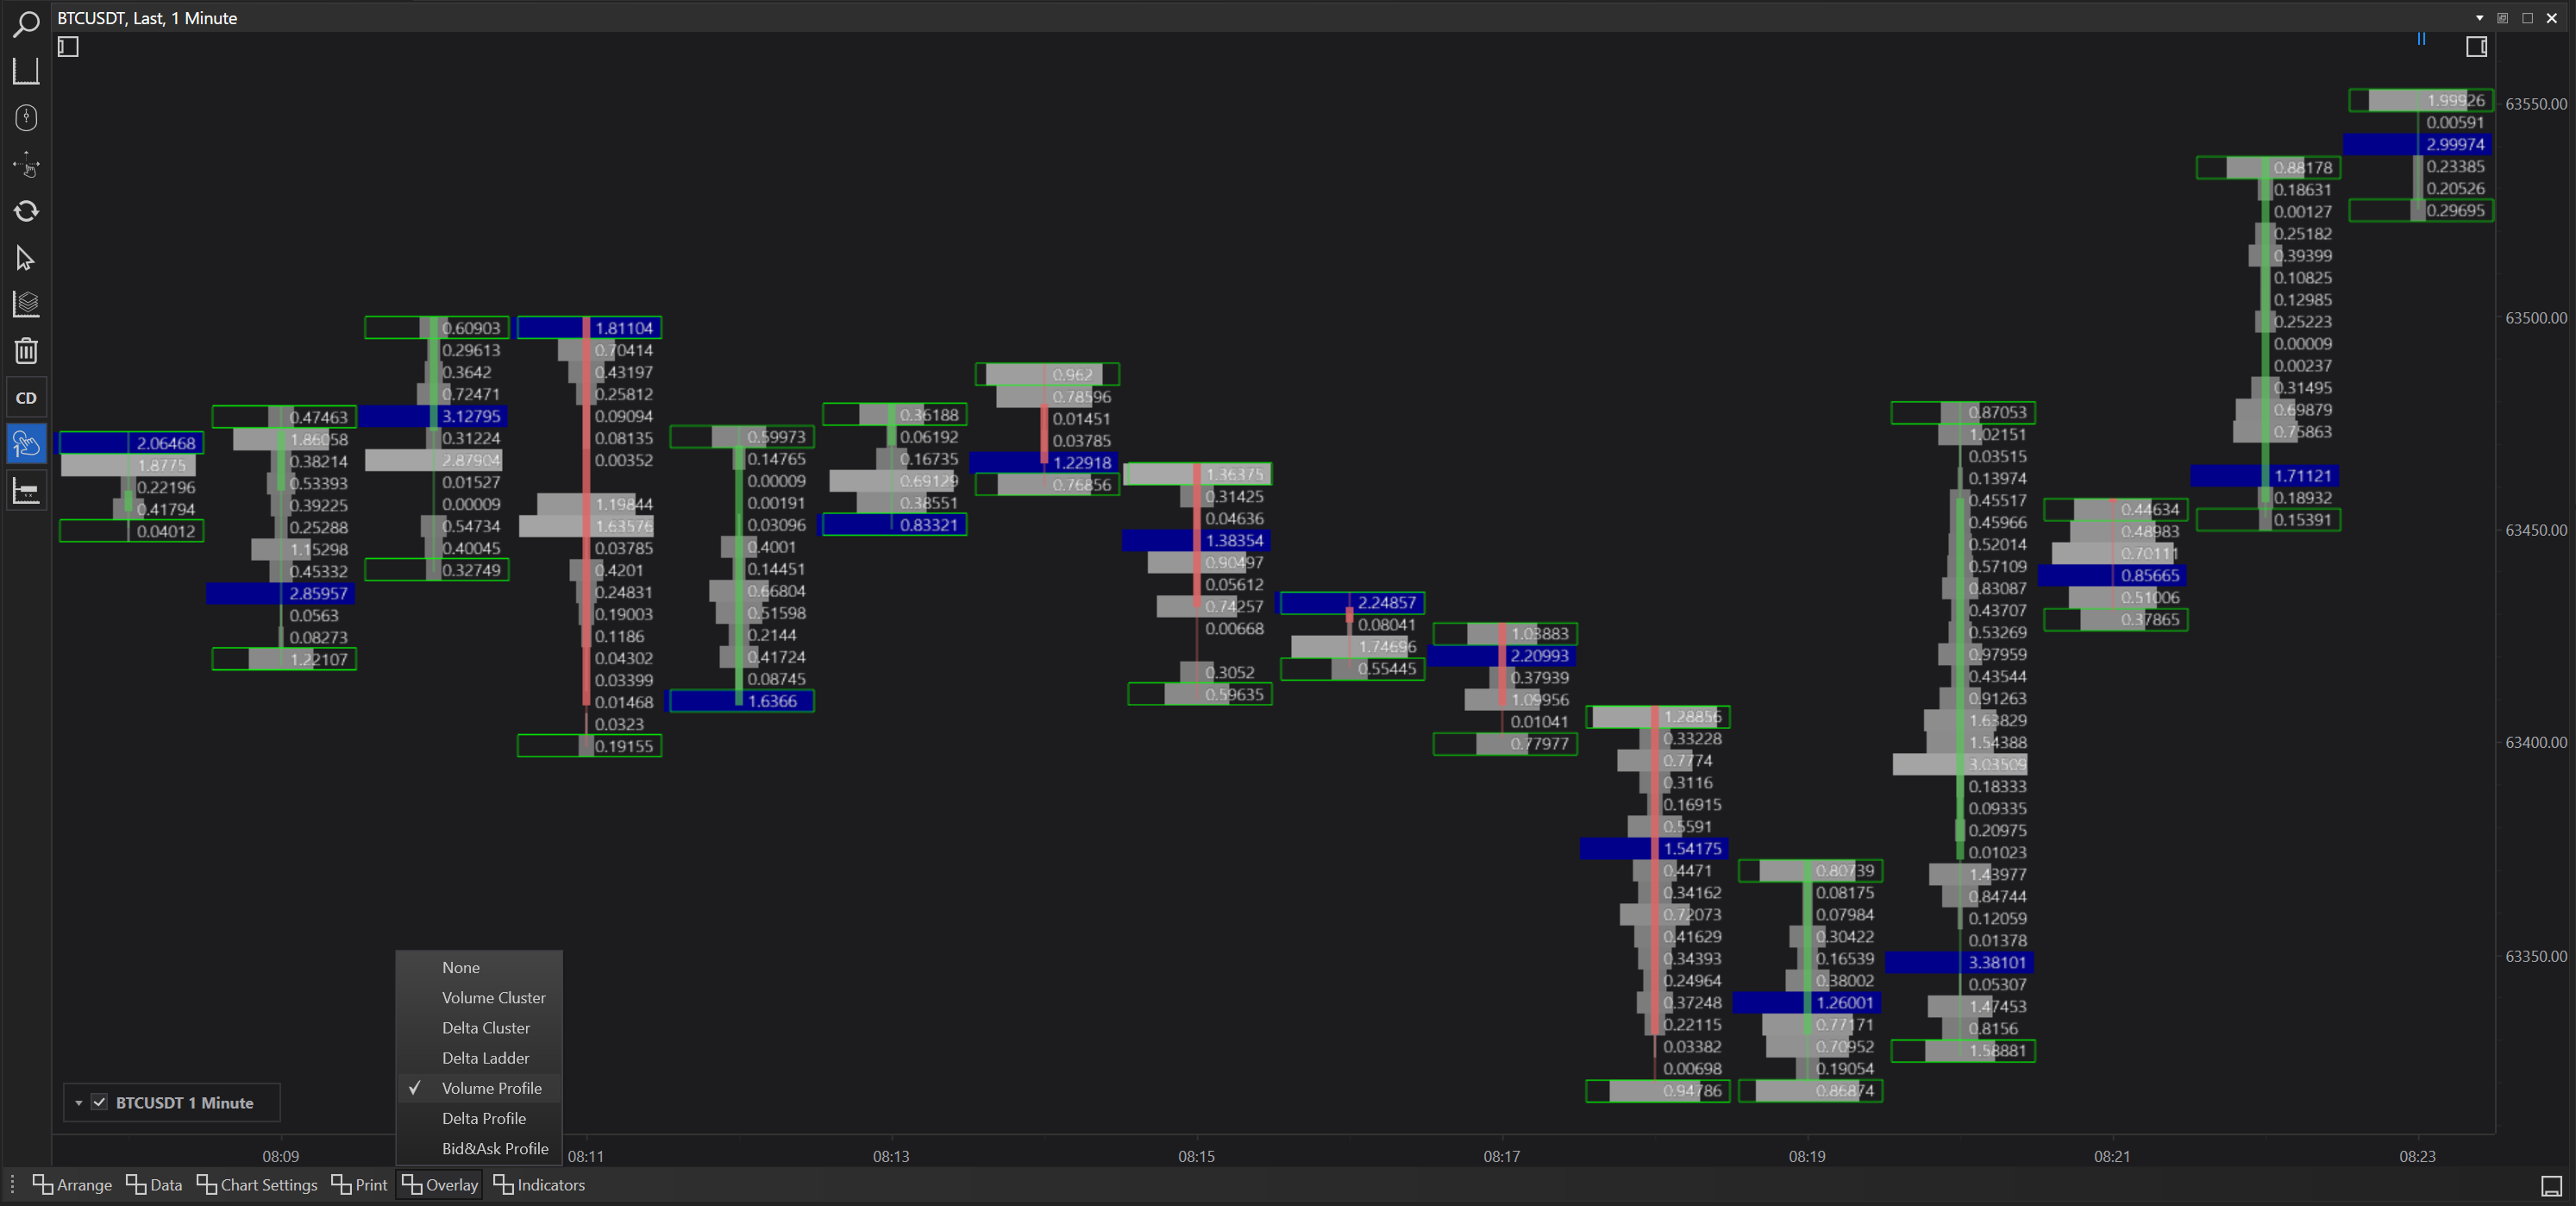
- Volume Profile: Displays a histogram of trading volume at different price levels alongside the chart, which helps in identifying price levels with significant trading activity.
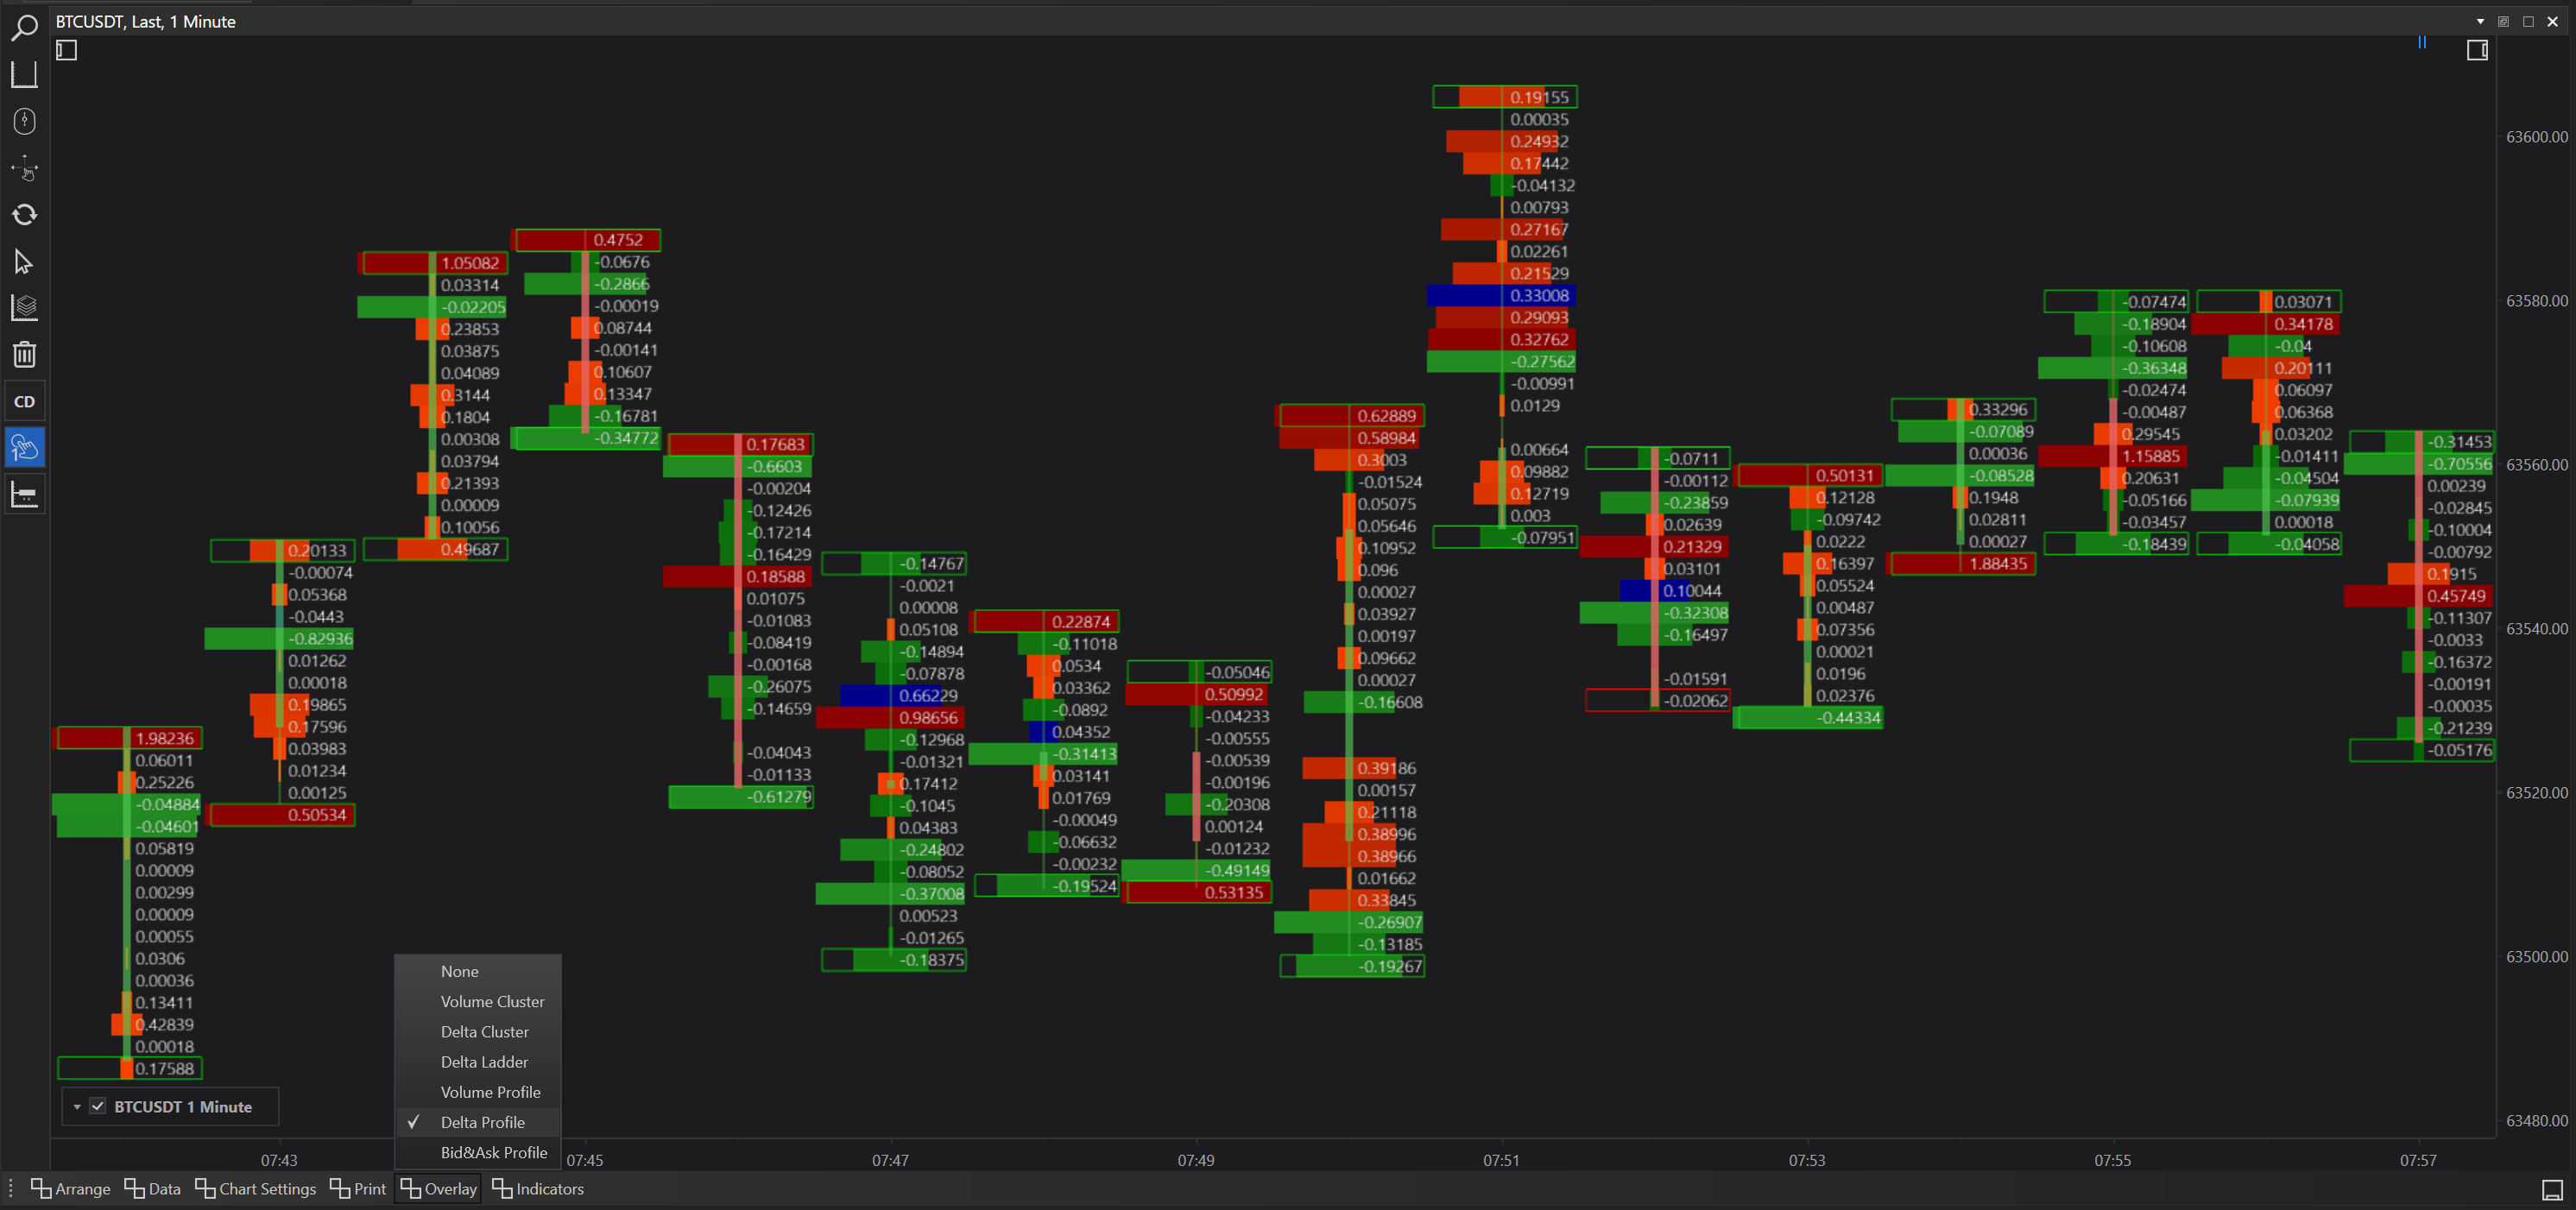
- Delta Profile: Similar to Volume Profile but focuses on the net buy/sell volume, highlighting dominant market forces.
- Bid & Ask Profile: Combines bid and ask volumes in a profile view, which can be pivotal for understanding the bid-ask spread dynamics throughout the trading session.
Combining Prints and Overlays
The real power of FinStudio’s Cluster Charts comes from the ability to combine different prints and overlays, allowing traders to tailor their analytical approach to fit specific scenarios:
- Strategic Combinations: For example, using the "Volume & Delta & Imbalance" print with a "Delta Profile" overlay can provide a deep understanding of not only where trades are happening but also the underlying buy or sell pressure and any potential imbalances that could predict future movements.
- Visual Clarity and Insight: This combination can highlight not just where the majority of trades are concentrated but also how these trades are influencing the market direction. This is crucial for making informed decisions, especially in fast-moving or volatile markets.
- Customizable Visualization: Traders can switch between different combinations to view the market from various perspectives, adapting the analysis to changing market conditions or different phases of their trading strategy.
Strategic Combinations:
Bid Ask Print with Bid Ask Profile Overlay: Integrates bid and ask data on both the print and overlay, providing a detailed view of market depth and trading intensity at every price level.
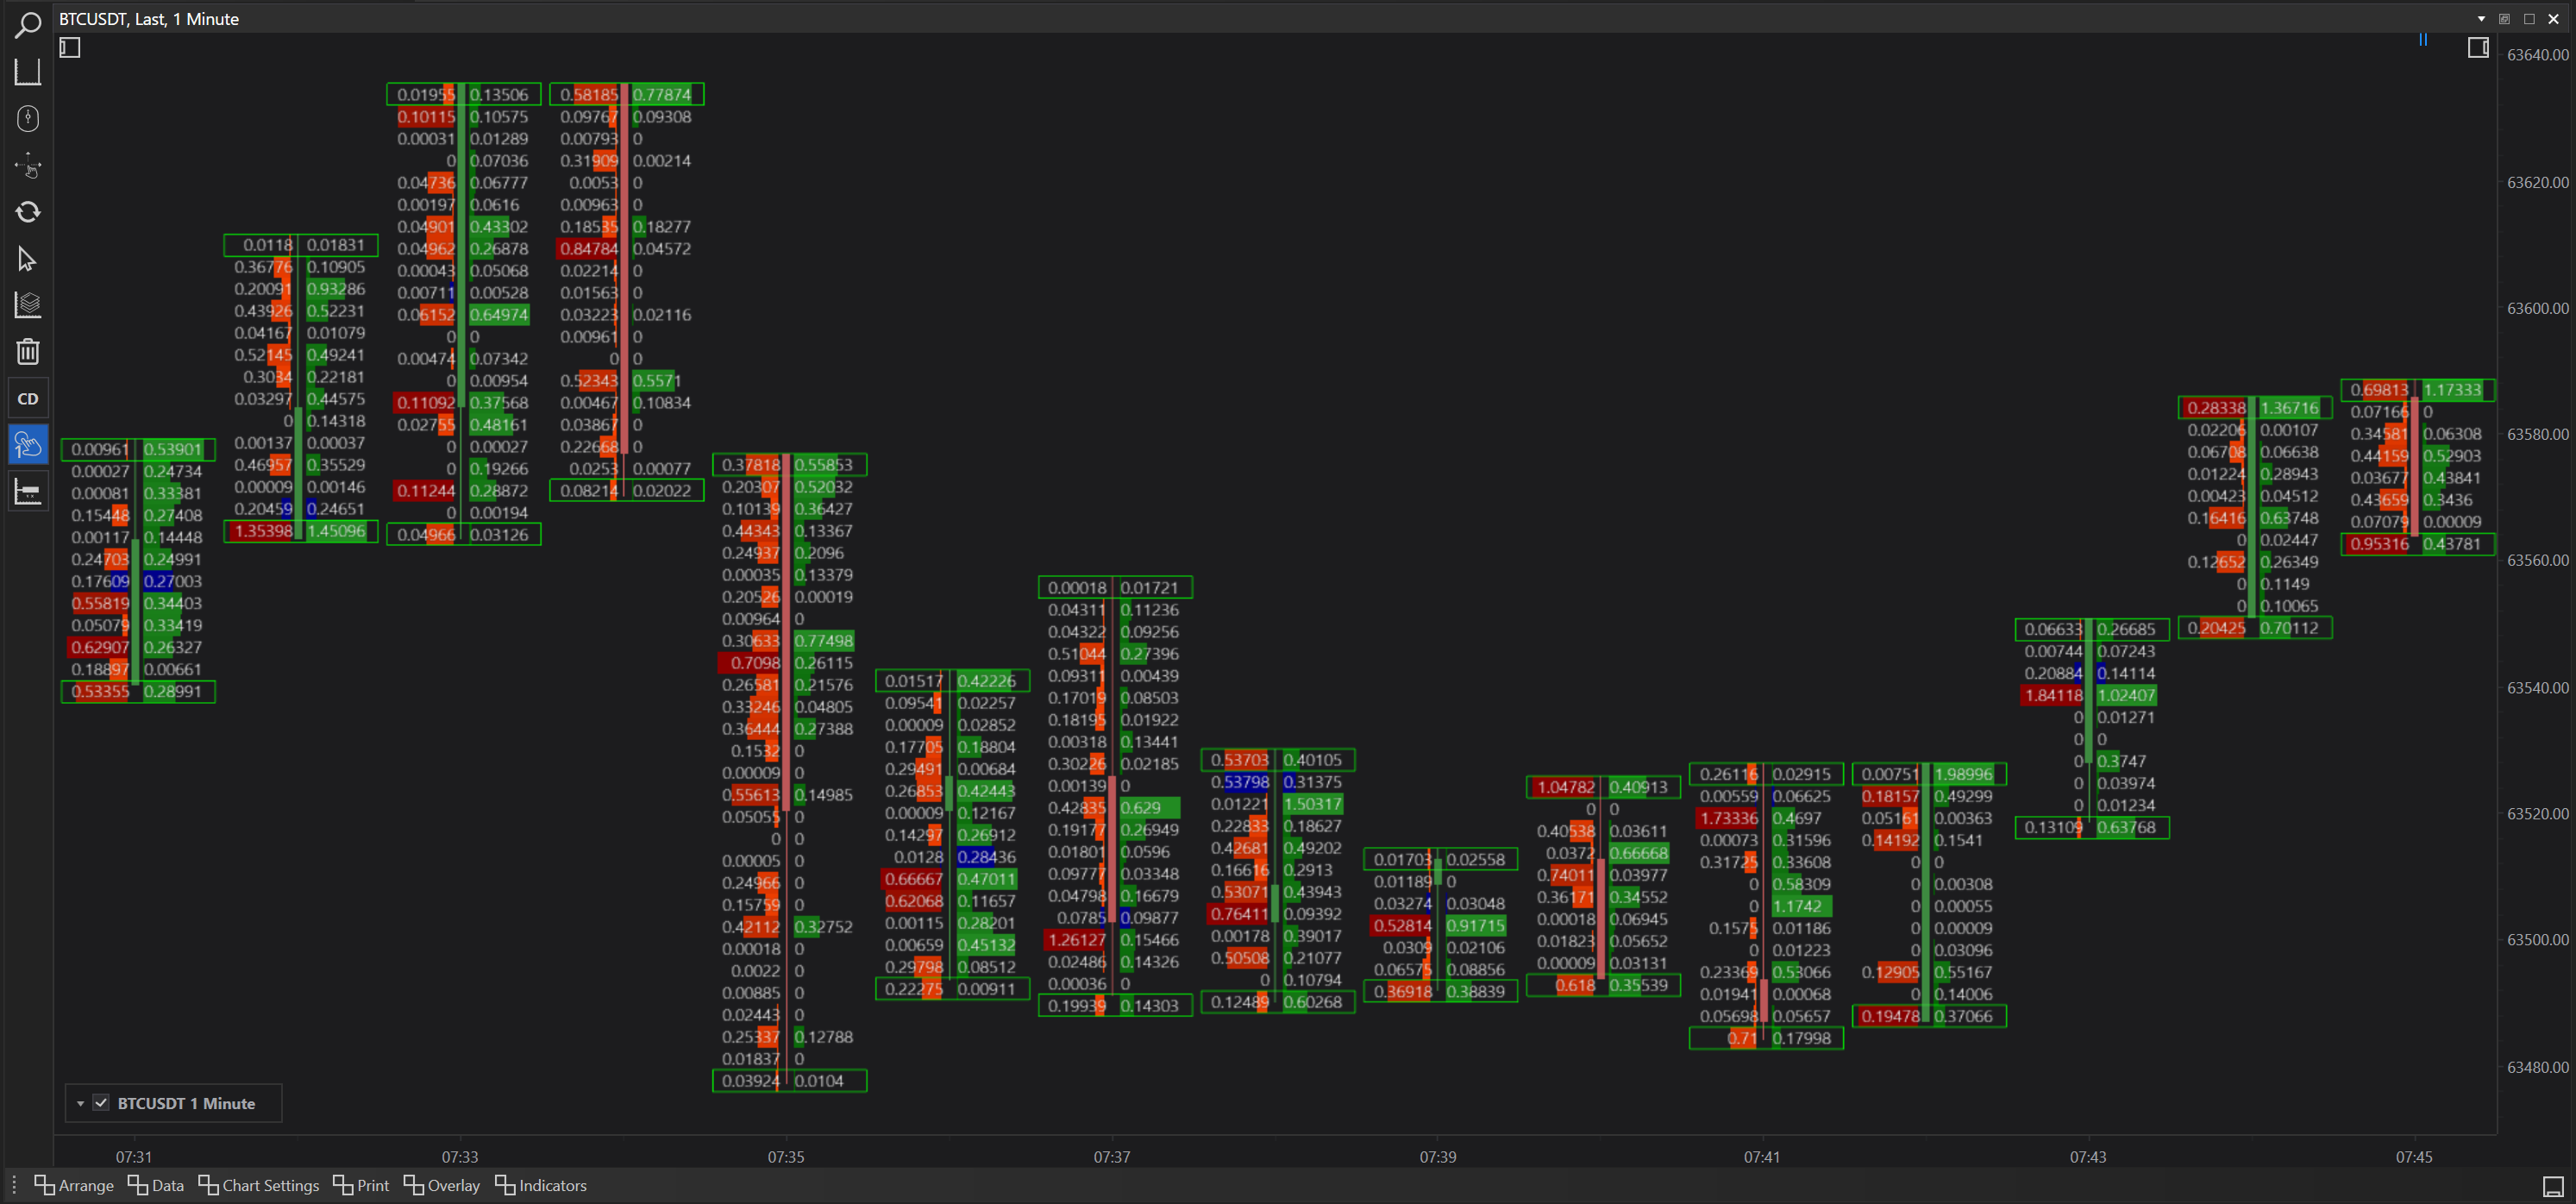
Delta Print with Delta Cluster Overlay: Highlights areas with significant buy or sell pressure by clustering delta values, useful for spotting potential reversal points.
Delta Print with Delta Ladder Overlay: Allows for a detailed analysis of how buying or selling pressure evolves with price changes, offering a dynamic view of market momentum.
Delta Print with Delta Profile Overlay: Combines delta data with its profile, enriching the analysis of net market buying or selling pressure across different price levels.
Imbalance Print with Bid Ask Profile Overlay: Focuses on price levels where buy-sell imbalances occur alongside a detailed bid-ask volume analysis.
Volume, Delta, Imbalance Print with Delta Cluster Overlay: Offers a comprehensive look at volume, market direction, and imbalances, further detailed by clustering deltas for depth analysis.
Volume Print with Volume Cluster Overlay: Groups trade volumes at specific price levels, helping to identify key support and resistance zones.
Volume Print with Volume Profile Overlay: Provides a histogram view of trading volume, allowing for an easy comparison of volume distribution across price levels.
Conclusion
By offering a range of prints and overlays that can be freely combined, FinStudio’s Cluster Charts provide a sophisticated toolset for traders looking to conduct detailed market analysis. This flexibility not only enhances the visual representation of market data but also deepens the trader’s ability to interpret complex market dynamics effectively, ultimately aiding in more informed and strategic trading decisions.