High - Low Box Charts: Simplifying Price Range Analysis
High - Low Box charts offer a distinct approach to market analysis by focusing on the highest and lowest prices within a given period, presenting them in a simplified box format. This article explores the principles, types, and uses of High - Low Box charts in FinStudio, providing a streamlined tool for traders to assess market volatility and price stability.
History and Concept
High - Low Box charts derive from the broader category of price range analysis tools in technical analysis. While traditional charts like candlesticks provide detailed views of price actions, High - Low Box charts strip down the data to essentials, focusing solely on the extreme values. This simplification helps traders quickly gauge the volatility of the market without the detailed scrutiny of opening and closing prices.
Basic Principles of High - Low Box Charts
These charts are characterized by their focus on depicting only the highest and lowest prices reached during a specific period. This visualization helps in highlighting the range of price movement, providing clear insights into the market's volatility during that interval.
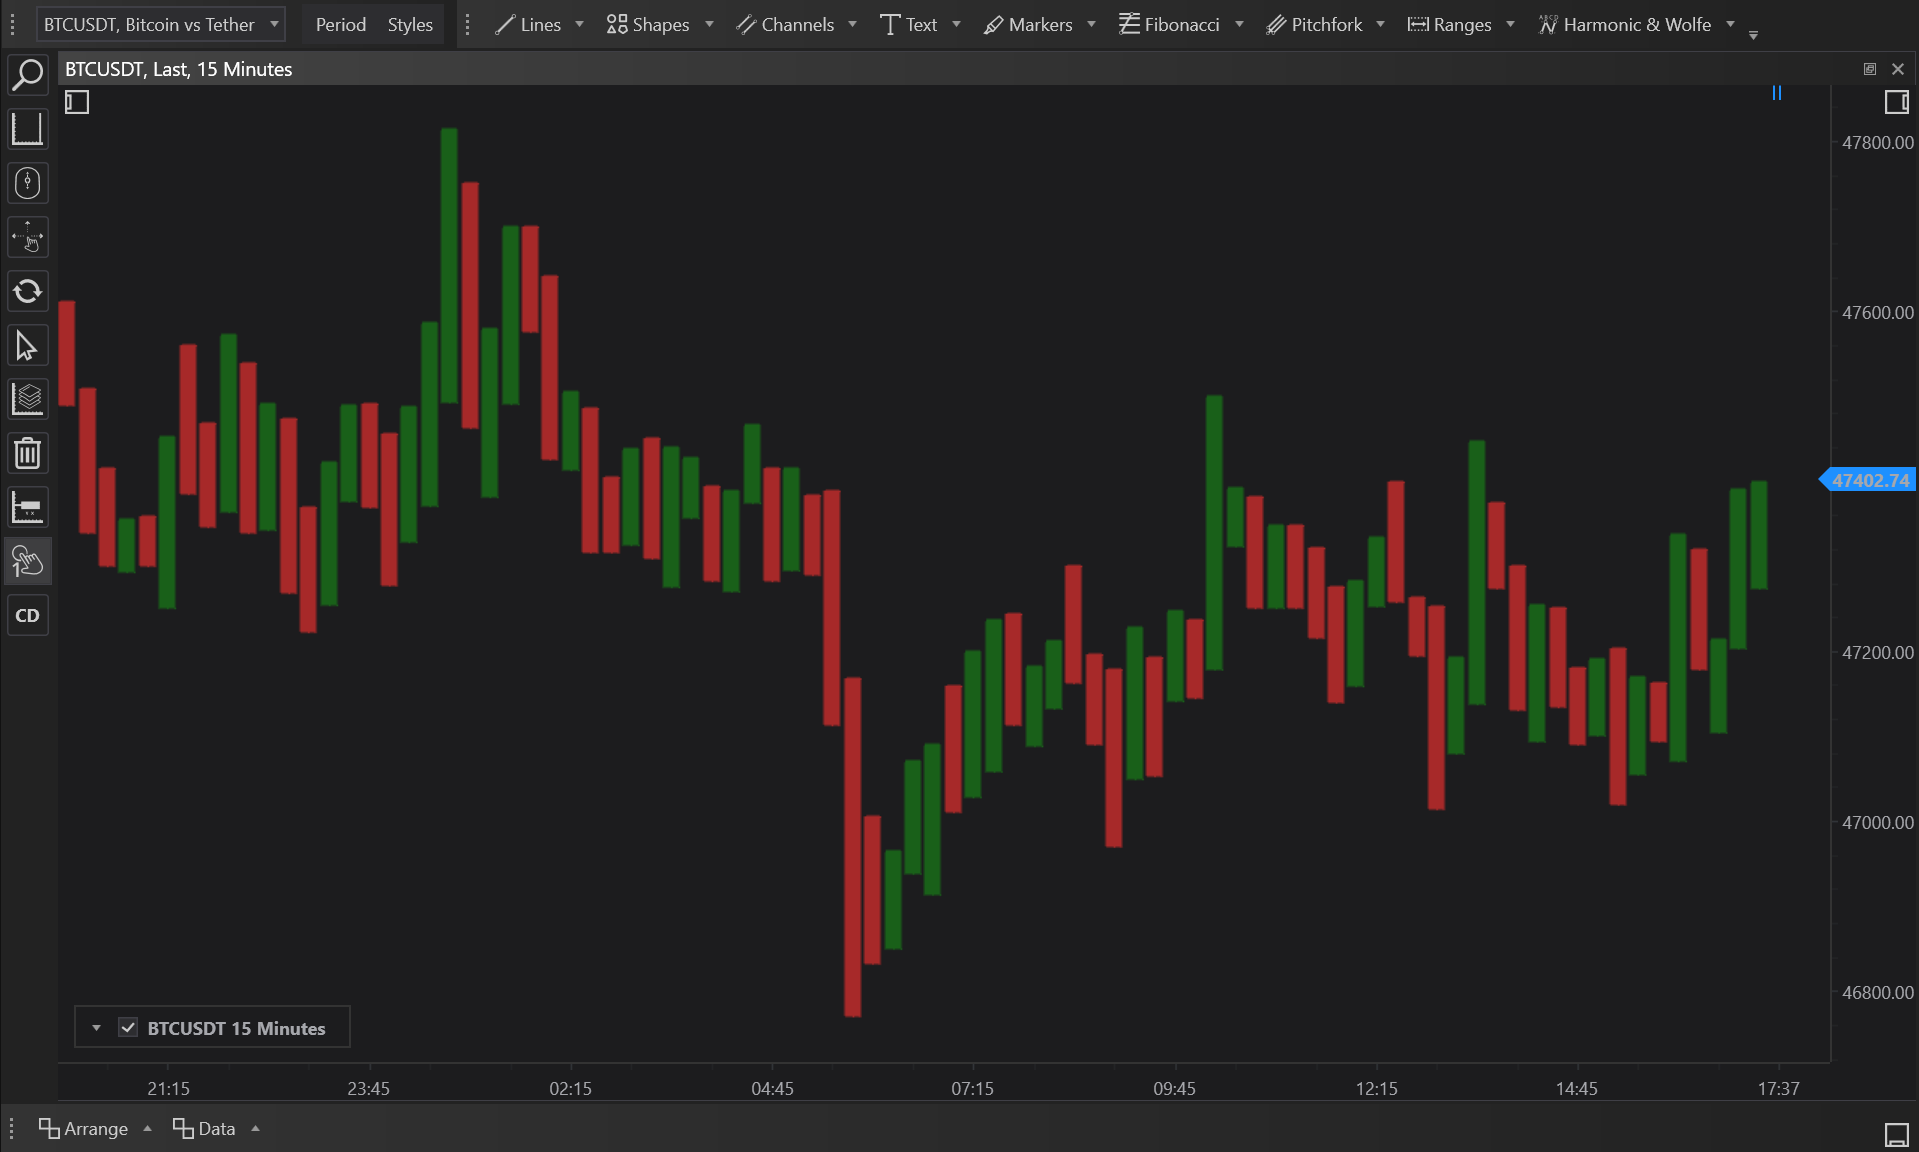
- Filled Body: Represents the range between the highest and lowest prices with a filled box, offering a visual measure of price fluctuation.
- Body Border Only: Uses just the outline of the box to denote high and low prices, minimizing visual distraction and focusing on price boundaries.
Types of High - Low Box Charts in FinStudio
FinStudio caters to various analytical preferences by offering different styles of High - Low Box charts:
-
Filled Body:
- The box is solidly filled, clearly indicating the range between the highest and lowest trading prices within the period.
-
Body Border Only:
- This style shows only the border of the box, providing a minimalist view that emphasizes the extent of price fluctuation without filling details.
-
Box in Middle of Text (Text Visible in Cluster Chart Mode):
- Integrates the price range box within textual data in the middle, facilitating simultaneous analysis of numerical data and contextual information.
-
Box on Left from Text (Text Visible in Cluster Chart Mode):
- Places the box to the left of associated textual data, aligning numerical data neatly with descriptive analysis, enhancing data readability and comparison.
Usage of High - Low Box Charts
High - Low Box charts are particularly useful in environments where traders need to quickly assess the extremities of market price movements. These charts are ideal for:
- Volatility Assessment: Quickly identify periods of high volatility with wider boxes indicating larger price ranges.
- Trend Confirmation: Narrow boxes might suggest low volatility and a potential consolidation period, which could precede a breakout.
Applications and Benefits
- Simplicity and Clarity: Offers an uncluttered view, making it easier for traders to assess market volatility at a glance.
- Focus on Price Extremes: Emphasizes the most critical price levels reached during the trading period, which can be pivotal for setting stop-loss or take-profit orders.
Pros and Cons
Pros:
- Efficient Data Presentation: Reduces complexity by focusing on high and low prices, which are often key indicators of market sentiment.
- Enhanced Focus on Extremities: Helps traders focus on maximum and minimum price levels, which are crucial for volatility analysis.
Cons:
- Lacks Comprehensive Price Information: Does not provide insights into the opening and closing prices, which can be significant for complete market analysis.
- Limited Use for Detailed Strategies: May not be suitable for strategies that require detailed analysis of full price movements including opens and closes.
Conclusion
High - Low Box charts serve as a powerful analytical tool in FinStudio, offering a focused view of the market's price range and volatility. By simplifying the traditional charting methods to just the extremes of price action, these charts provide a quick and clear way to assess market conditions. Ideal for traders who need to make fast decisions based on critical price levels, High - Low Box charts are an excellent addition to the trader’s toolkit, offering a balance between simplicity and insightful market analysis.