In this section
Market Profile Charts: Detailed Overview
Market Profile is a sophisticated charting technique that has become an invaluable tool for traders aiming to analyze market dynamics effectively. Unlike traditional charting methods that focus primarily on price movements, Market Profile charts provide a more comprehensive view by combining price, volume, and time on a single chart. This article will delve into the history, principles, and practical applications of Market Profile charts, exploring both their advantages and the challenges associated with their use.
History and Origins of Market Profile
Market Profile was developed in the early 1980s by Peter Steidlmayer, a trader at the Chicago Board of Trade (CBOT). Steidlmayer sought to evaluate market value as it developed throughout the trading day, introducing a way to organize data that could capture the market's dynamics more accurately than traditional charts. His methodology provided a new way to look at price, volume, and time, which are crucial components of how traders understand market conditions.
Basic Principles of Market Profile
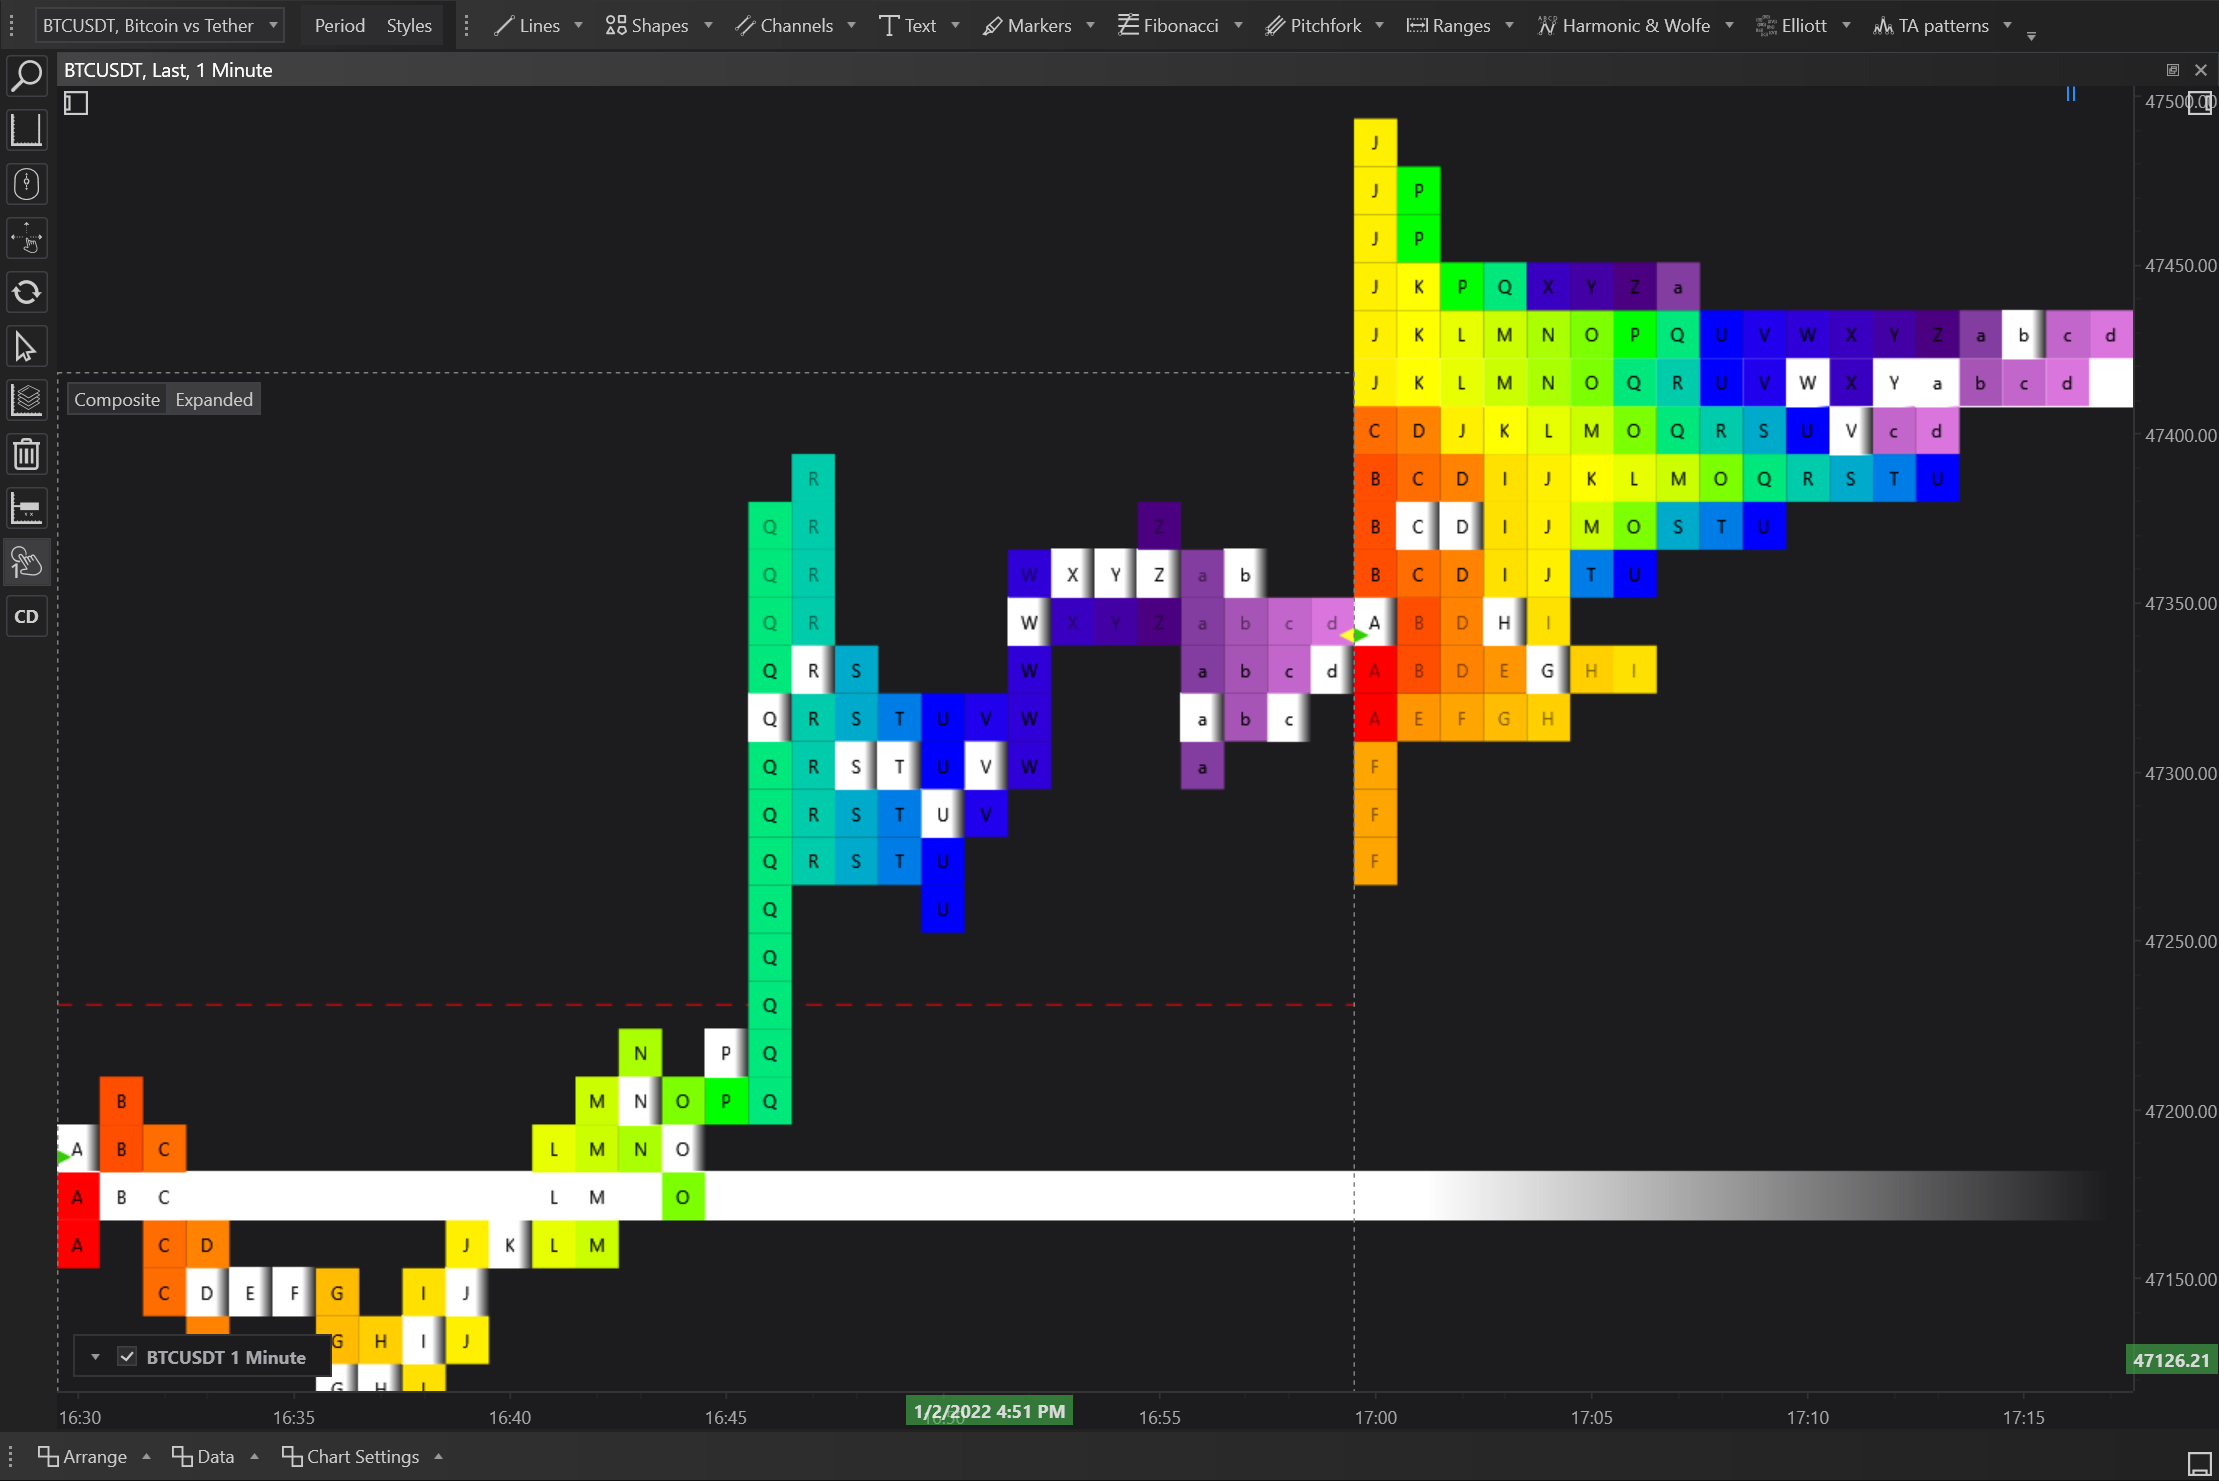
Market Profile charts represent trading activity over a specified time frame, plotting price against time in a statistical bell curve format. This format helps traders identify prices favored by the market and the amount of time the market spent at each price level, giving insight into potential support and resistance levels. The key elements of Market Profile include:
- Price Levels: Similar to the y-axis on a typical chart, but it displays the entire range of trading activity for a day or specific trading session.
- Time Price Opportunities (TPOs): Each price level is marked with a letter or symbol representing a specific time segment during which the market traded at that price. More symbols at a price level mean more trading activity.
- Value Area: Typically includes approximately 70% of the total volume traded during the session. It highlights where most of the trading activity took place and is considered the "fair value" range by market participants.
- Point of Control (POC): The price level with the most trading activity during the session, indicating the highest accepted value.
Construction and Use of Market Profile Charts
To construct a Market Profile chart, follow these general steps:
- Select the Time Frame: Choose the trading session or duration over which you want to analyze market activity.
- Determine Price Levels: Plot all the price levels at which trades occurred during the selected timeframe.
- Assign TPOs: Mark the TPOs for each time segment at the corresponding price levels.
- Identify the Value Area and POC: Highlight the value area and identify the POC, which is where the most TPOs appear.
Types of Market Profile Charts in FinStudio
FinStudio enhances the capabilities of Market Profile charts by offering detailed customization options that cater to various trading preferences and strategies:
- Standard Market Profile: Displays the classic bell-shaped curve, allowing traders to quickly identify value areas and points of control.
- Volume Profile Integration: Combines volume data with the Market Profile, providing a deeper understanding of price levels based on volume concentration.
- Customizable Time Frames: Traders can set specific time frames for analysis, adapting the chart to fit short-term trades or longer-term strategies.
Usage of Market Profile Charts
Market Profile charts are utilized by traders to gain insights into market structure and trading behaviors. They are particularly useful for:
- Identifying Market Trends: By analyzing the shape and location of the value area, traders can determine the market's strength and directional bias.
- Support and Resistance Levels: The edges of the value area serve as potential support and resistance levels.
- Volume Analysis: Integrating volume with price and time helps in understanding the conviction behind price movements.
Examples of Trading Using Market Profile
- Identifying Breakouts: A move beyond the value area can signal a potential breakout, prompting traders to initiate trades in the direction of the breakout.
- Range Trading: Within the value area, traders can buy at the lower boundary and sell at the upper boundary, capitalizing on the market's acceptance of value.
Pros and Cons of Trading with Market Profile
Pros:
- Provides a multidimensional view of the market, combining price, volume, and time.
- Helps identify high-probability trading opportunities based on key market levels.
- Widely recognized and used by professional traders for its depth of information.
Cons:
- Requires a steep learning curve to interpret effectively.
- May not provide timely signals for very short-term trading.
- Relies heavily on the trader's ability to interpret complex data structures.
Conclusion
Market Profile charts offer a unique and powerful way for traders to view market activity and make informed trading decisions. By understanding the nuances of how markets operate through the lens of Market Profile, traders can better position themselves to take advantage of natural market movements. Despite its complexities, the depth of insight provided by Market Profile charts makes them an essential tool for serious traders aiming to understand and capitalize on market dynamics.