Market Profile Chart Settings
Market Profile charts in FinStudio are highly customizable, allowing traders to adapt the tool to their specific analytical needs.
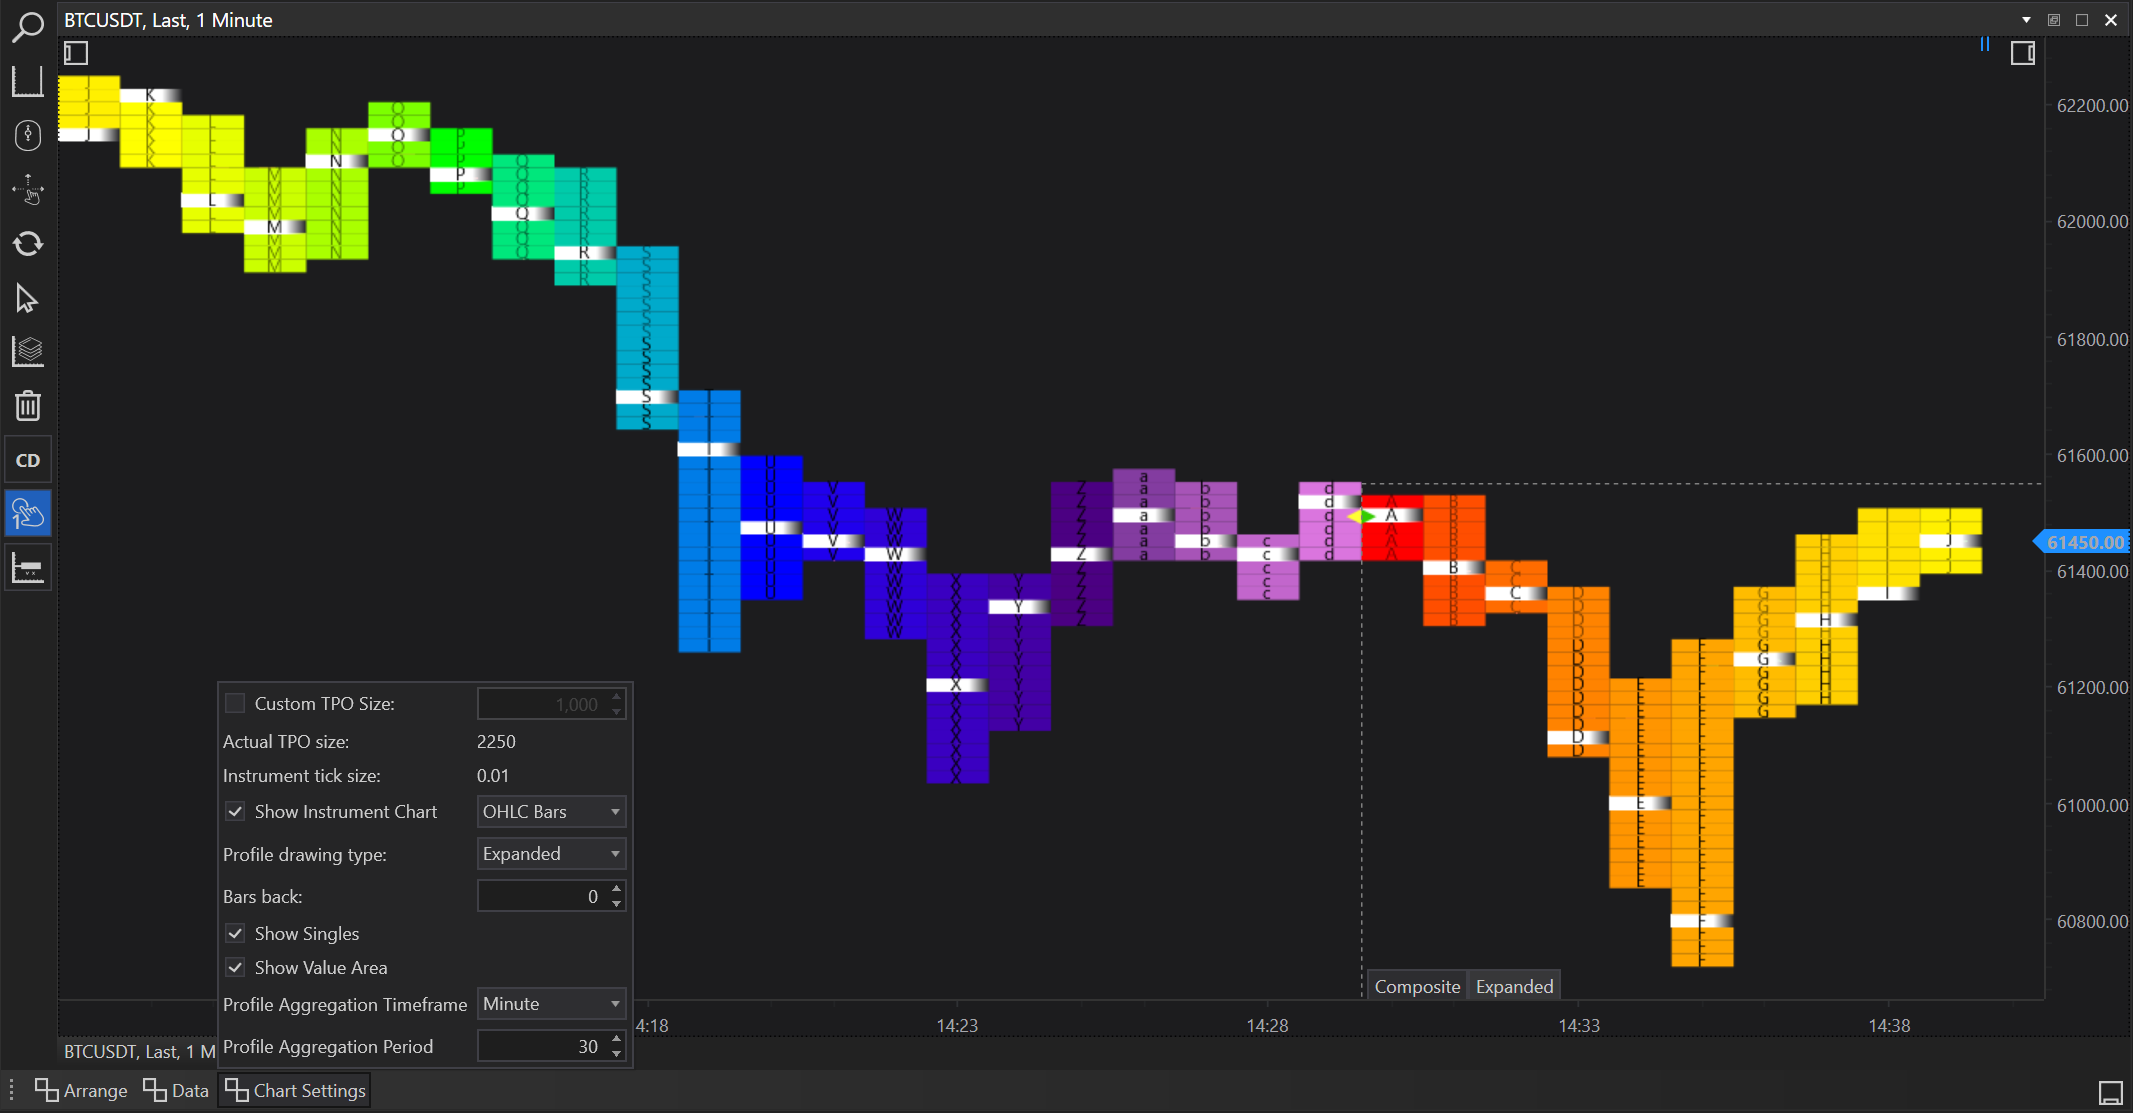
Below is a detailed explanation of the various settings available for Market Profile charts:
Custom TPO
- Option: Checkbox with an adjustable input box.
- Functionality: Allows traders to define a custom Time Price Opportunity (TPO) size, overriding the default settings. This can be used to adjust the granularity of the Market Profile, making it more or less detailed based on the trader's requirements.
Actual TPO Size
- Functionality: Displays the current size of TPOs used in the Market Profile chart, which can be adjusted if the Custom TPO option is enabled.
Instrument Tick Size
- Functionality: Shows the minimum price movement of the instrument, important for setting appropriate TPO sizes relative to the instrument's price volatility.
Show Instrument Charts
- Option: Checkbox that enables a select box with options for displaying Candlesticks or OHLC Bars.
- Functionality: Allows the overlay of traditional chart types over the Market Profile. This can provide a visual representation of price action alongside the Market Profile, although in the Expanded profile type, this can be less visible due to the dominant Market Profile visualization.
Profile Drawing Type
- Options: Composite or Expanded.
- Functionality: Determines how the Market Profile is drawn on the chart. Composite profiles integrate the Market Profile with traditional chart views, while Expanded profiles focus solely on Market Profile data, typically covering the entire chart area.
Bars Back
- Option: Input field (default is 0).
- Functionality: Defines how many bars back the Market Profile should calculate and display. Setting this to 0 calculates the Market Profile based on all available data on the chart.
Show Singles
- Option: Checkbox.
- Functionality: When enabled, it highlights 'Singles' or single prints within the Market Profile. These are areas where the price has only briefly visited, indicating potential zones of low agreement or rapid price movement.
Show Value Area
- Option: Checkbox.
- Functionality: Enables the display of the Value Area, the range where approximately 70% of the trading volume occurred, marking it as a significant zone for the trading session.
Profile Aggregation Timeframe
- Option: Select box with intervals including tick, second, minute, hour, day, week, month, year.
- Functionality: Selects the base timeframe for aggregating data into the Market Profile. This setting determines the temporal resolution of the profile, affecting how market dynamics are aggregated and displayed.
Profile Aggregation Period
- Option: Input box.
- Functionality: Allows the user to specify the period of the selected aggregation timeframe. For example, setting this to '30' with a 'minute' timeframe would aggregate data into 30-minute blocks.
These settings provide traders with extensive control over how Market Profile charts are displayed and interact with, allowing for a tailored approach to analyzing market structure and behavior. By fine-tuning these settings, traders can better align the tool with their trading strategy and market conditions, leveraging the unique insights provided by Market Profile analysis.