Explaining Composite and Expanded Market Profile Charts
Market Profile charts are a sophisticated tool used by traders to analyze market dynamics based on price action and volume over time. FinStudio offers two distinct ways of displaying Market Profile charts: Composite and Expanded. Each style provides a unique perspective on market data and caters to different analytical needs. Here’s a detailed explanation of both types:
Composite Market Profile
The Composite Market Profile view in FinStudio displays a compact representation of trading activity, where each bar on the chart is marked with small letter boxes that represent different trading periods within the day. This style is particularly useful for traders who want to see the detailed development of price levels across multiple sessions combined into a single profile.
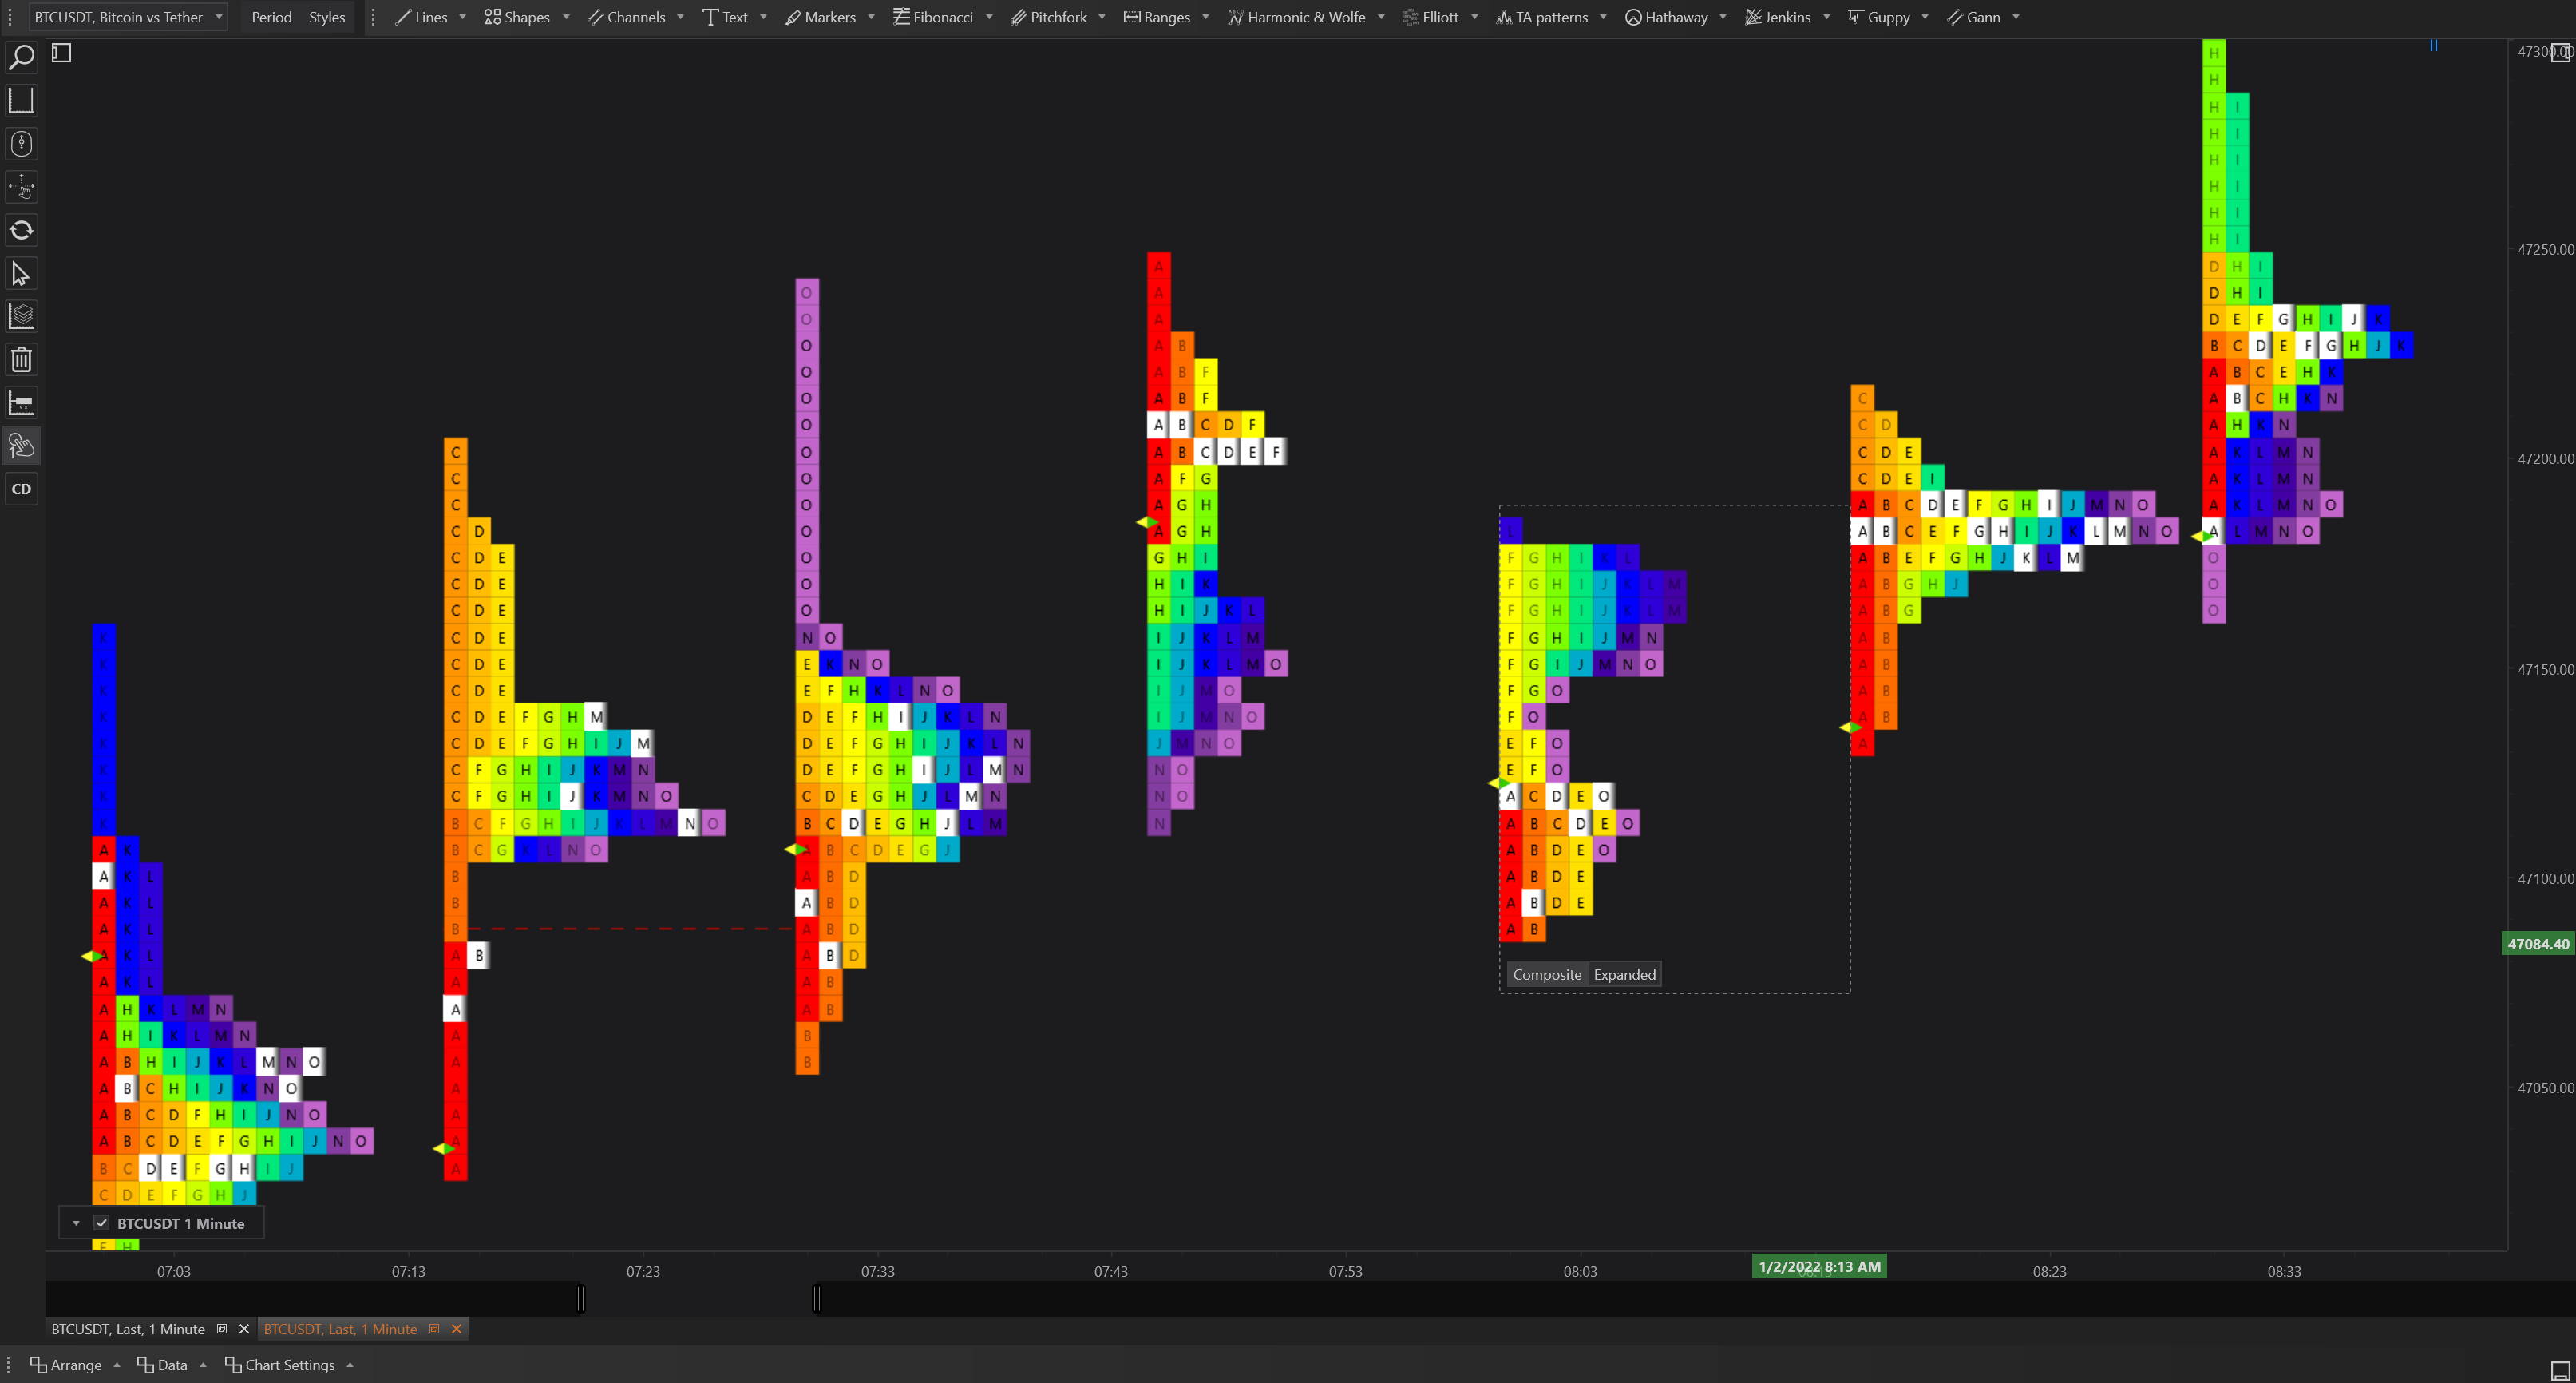
Characteristics of Composite Market Profile:
- Time Consolidation: It combines data from several trading sessions into one profile, giving a broader view of support, resistance, and value areas over a longer timeframe.
- Letter Boxes on Bars: Each bar contains small boxes labeled with letters that correspond to specific time segments within the trading sessions. This format helps traders identify which time periods had the most trading activity at specific price levels.
- Focused Analysis: Ideal for traders who need to analyze the overall market structure over several days or sessions without focusing on the minutiae of each individual session.
Expanded Market Profile
In contrast, the Expanded Market Profile view presents data as an aggregated volume profile but still incorporates the small letter boxes within each price level. This method aggregates all trades and volumes into a continuous graphical representation, making it easier to identify where the majority of trading activity occurred over the selected period.
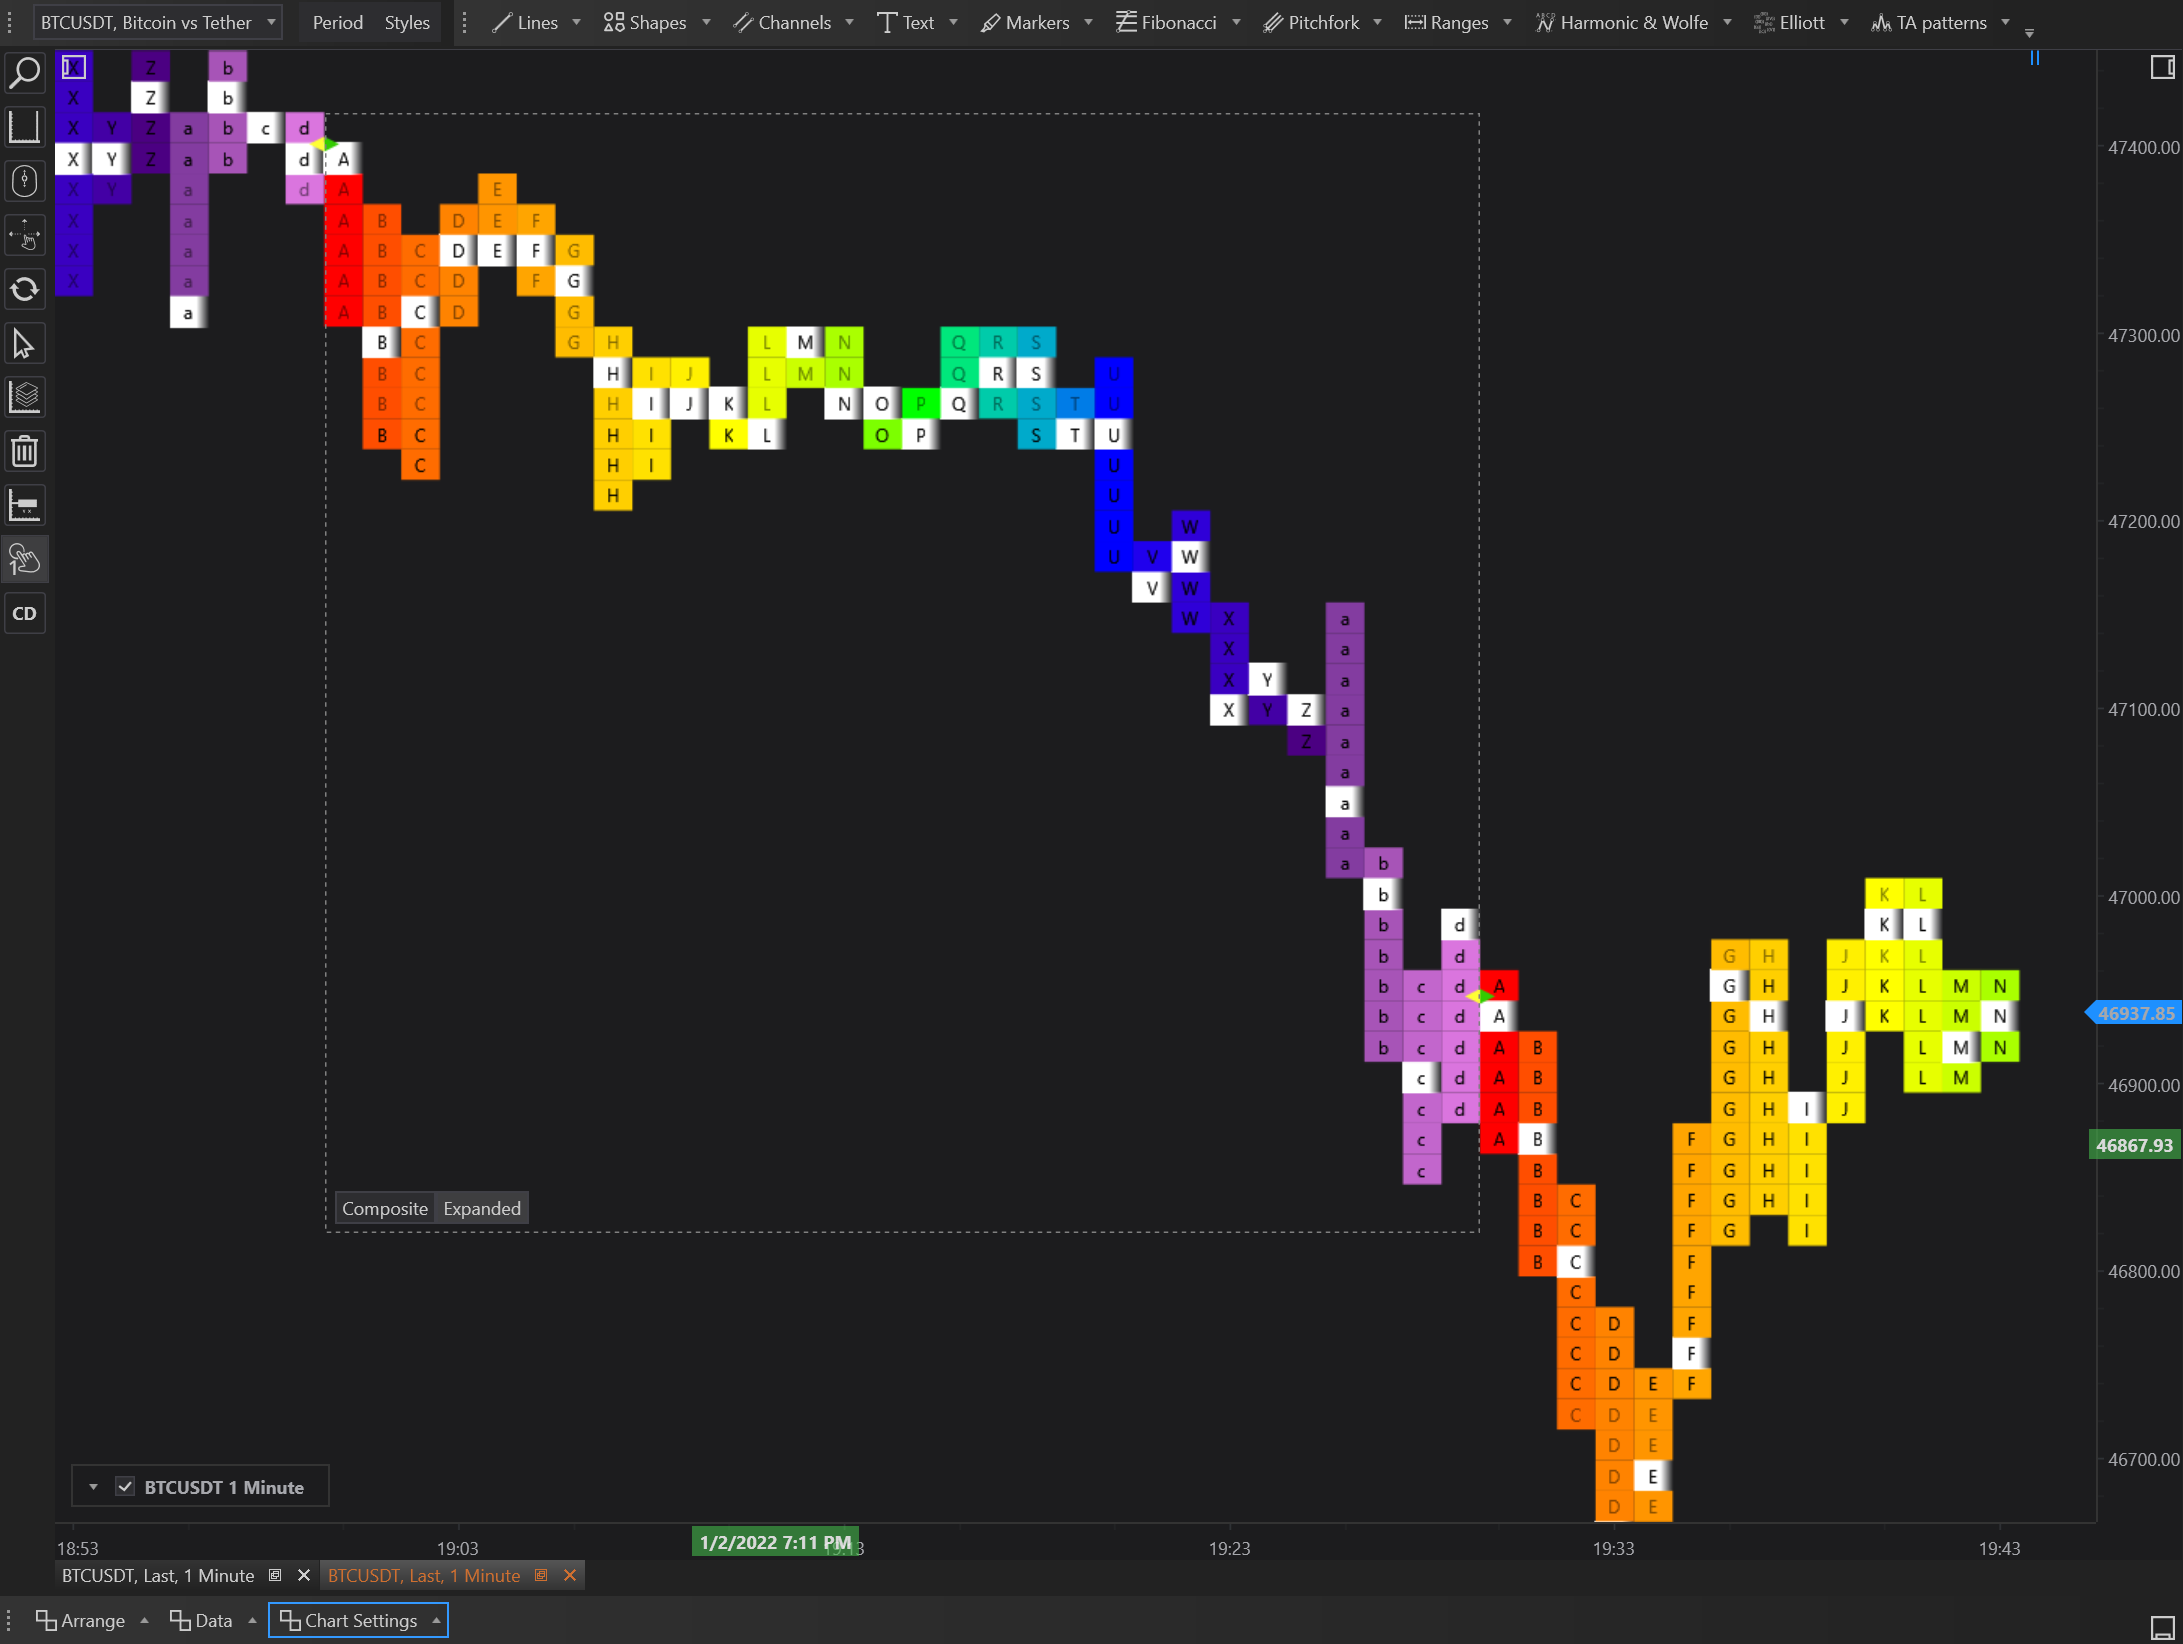
Characteristics of Expanded Market Profile:
- Volume Aggregation: Shows a clearer picture of where the bulk of trading activity is concentrated, highlighting significant price levels or zones.
- Detailed Letter Representation: Even though the data is aggregated, each price level still shows the letters representing different trading periods, allowing analysts to see the time-based distribution of trading volume within the broader context.
- Comprehensive View: Best suited for traders who are interested in understanding significant volume areas and how they relate to price movements over an extended period.
Practical Use in Trading
Both the Composite and Expanded Market Profile styles serve distinct purposes:
-
Composite Market Profile is particularly useful for traders who monitor the accumulation of trading activity over multiple sessions to gauge long-term support and resistance levels. It’s beneficial for strategic planning and trend analysis over weeks or months.
-
Expanded Market Profile is ideal for traders focusing on volume distribution within a given range and looking to understand market sentiment and potential price movements based on volume accumulation. It provides a macro view of market activity, helping to pinpoint areas of high liquidity and potential price pivots.
By offering both Composite and Expanded Market Profile charts, FinStudio caters to a wide range of trading styles and strategies, from short-term intra-day trading to long-term investment analysis, allowing traders to choose the format that best suits their analytical needs and trading objectives.