History and Origins
Open - Close Box charts derive from the broader family of candlestick charts, which originated in Japan over 200 years ago. While traditional candlestick charts were designed to provide a comprehensive view of price movements, Open - Close Box charts simplify this view by eliminating the wicks and focusing on the core price movements — the opens and closes. This simplification helps traders focus on the fundamental market sentiment of opening versus closing values.
Basic Principles of Open - Close Box Charts
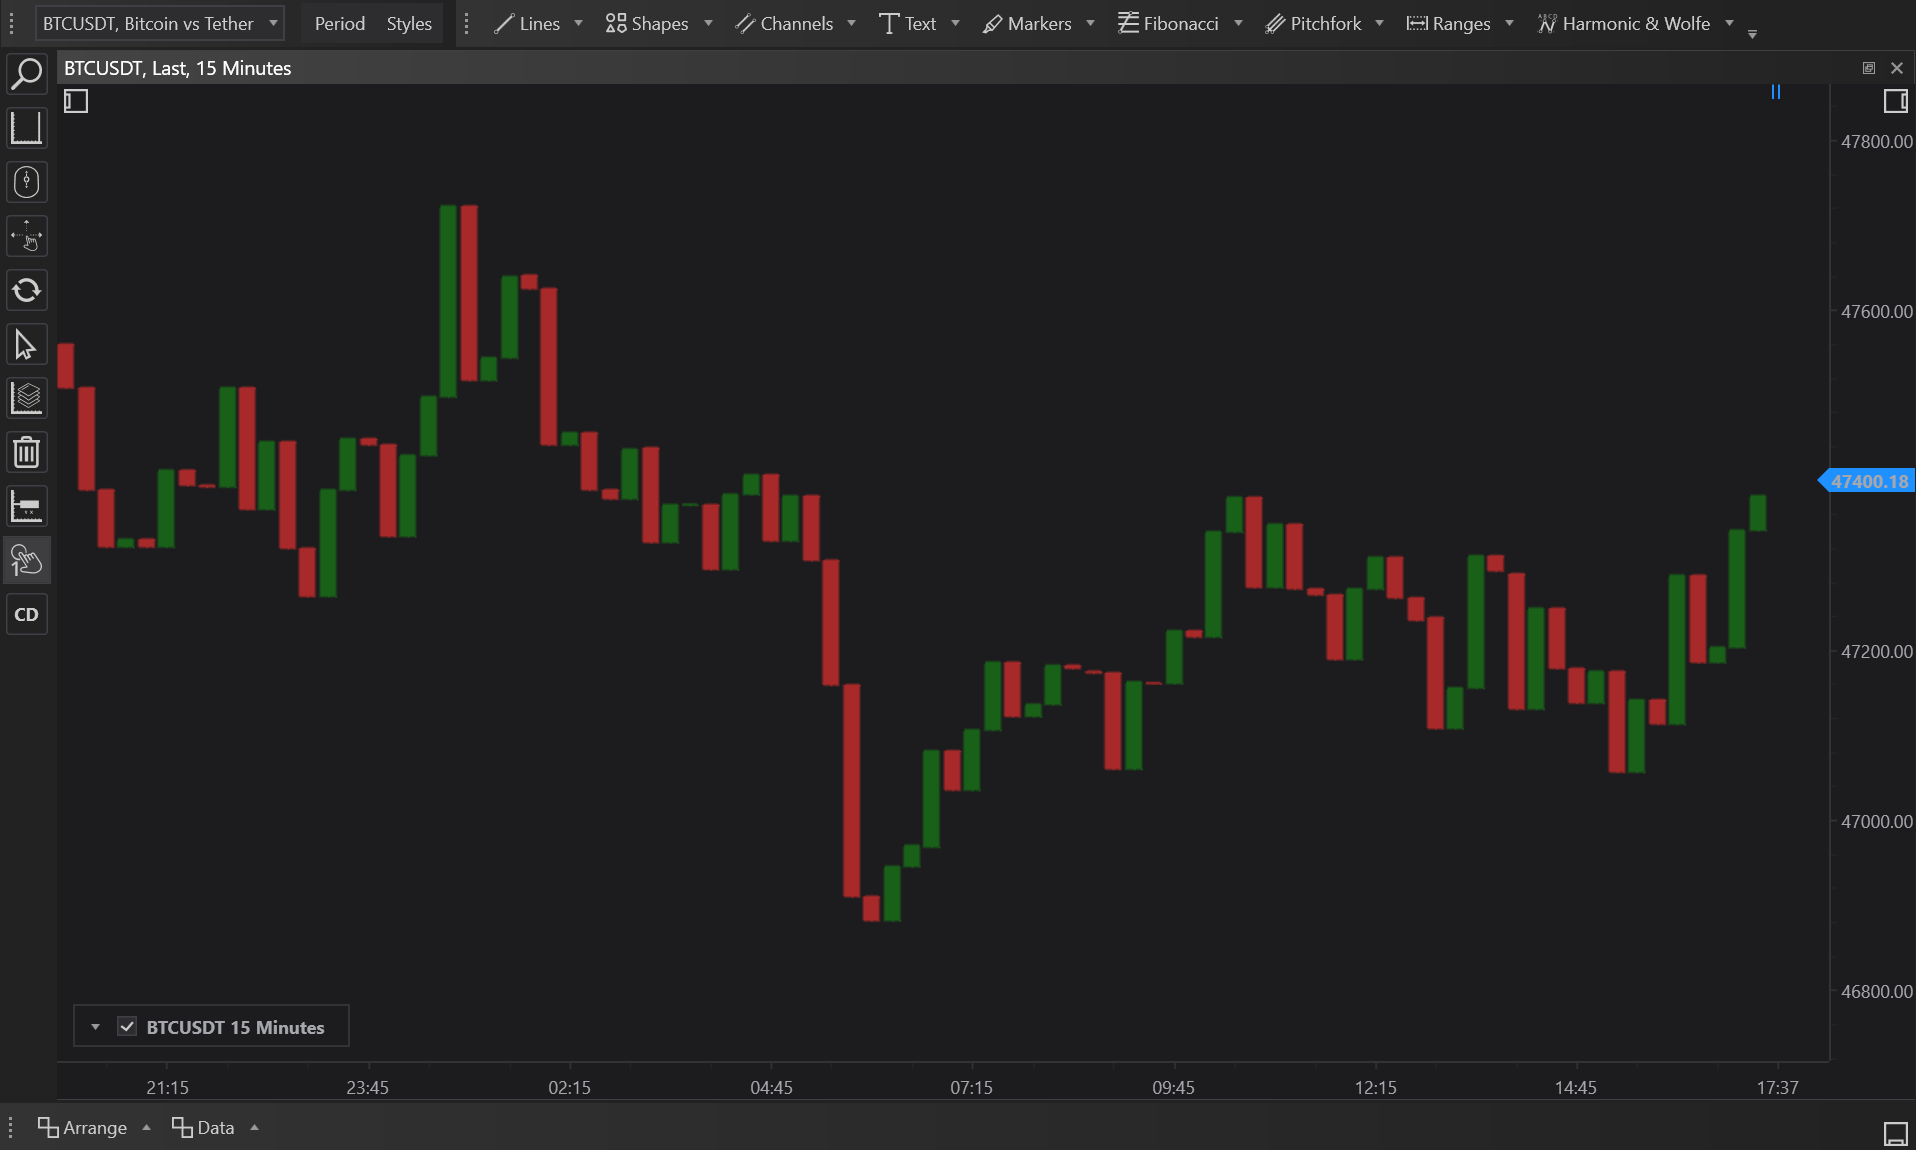
These charts represent price action using boxes that display the range between the opening and closing prices for a given timeframe. The absence of high and low indicators helps traders concentrate on the primary market direction and sentiment during the trading period.
- Filled Body: Indicates a period where the closing price is lower than the opening price, typically colored differently to signify a decrease in price.
- Unfilled Body: Shows a period where the closing price is higher than the opening price, typically lighter or a different color to indicate an increase in price.
Types of Open - Close Box Charts in FinStudio
FinStudio enhances the functionality of Open - Close Box charts with customizable styles that cater to different analytical needs and presentation preferences:
- Filled Body:
- Shows a solidly filled box representing the open and close prices, providing a clear, unambiguous view of market movements.
- Body Border Only:
- Outlines the box without filling, focusing purely on the structural price movement between the open and close.
- Box in Middle of Text (Text Visible in Cluster Chart Mode):
- Integrates textual data analysis by placing the open-close box in the middle of related textual information, facilitating a combined view of numerical and textual data.
- Box on Left from Text (Text Visible in Cluster Chart Mode):
- Aligns the box to the left of any associated textual data, making it easy to compare and contrast graphical data with its descriptive analysis side by side.
Usage of Open - Close Box Charts
These charts are particularly useful for traders who prefer a minimalist approach to technical analysis. By focusing solely on opening and closing prices, traders can quickly assess:
- Market Sentiment: Understanding whether the sentiment was bullish or bearish during the trading period based on the color and fill of the box.
- Price Consolidation: Identifying periods of consolidation where opening and closing prices are very close, signifying potential indecision in the market.
Applications and Benefits
Open - Close Box charts are suited for various trading scenarios:
- Intraday Trading: Traders can quickly gauge the day's momentum and make swift decisions based on the predominant box colors and their sequence.
- Pattern Analysis: Simplified patterns such as consecutive filled or unfilled boxes can indicate ongoing trends without the noise of minor price fluctuations.
Pros and Cons
Pros:
- Simplicity: Easier to interpret than more complex candlestick charts, especially for beginners.
- Focus on Key Prices: Emphasizes crucial price action information, making it straightforward to follow opening and closing trends.
Cons:
- Lack of Detail: Does not provide information about price extremes (highs and lows), which can be critical in volatile markets.
- Limited Use in Range Analysis: Without high and low data, identifying volatility and price ranges is more challenging.
Conclusion
Open - Close Box charts offer a refined approach to market analysis by stripping down the traditional candlestick format to its most essential elements. This simplification makes it an excellent tool for traders looking for clarity and efficiency in their chart analyses. While it may not provide the depth of information that other chart styles offer, its straightforward depiction of opening and closing prices can be incredibly effective for quick market assessments and decision-making.