Overview
The Standard Deviation Regression Channel in FinStudio provides traders with an advanced tool to gauge the volatility and predictability of price movements around a regression line. This channel applies standard deviation metrics to a linear regression of price data, highlighting the variability around the mean trend.
Construction and Use
- Select the Tool: Navigate to the drawing tools menu and select the Standard Deviation Regression Channel.
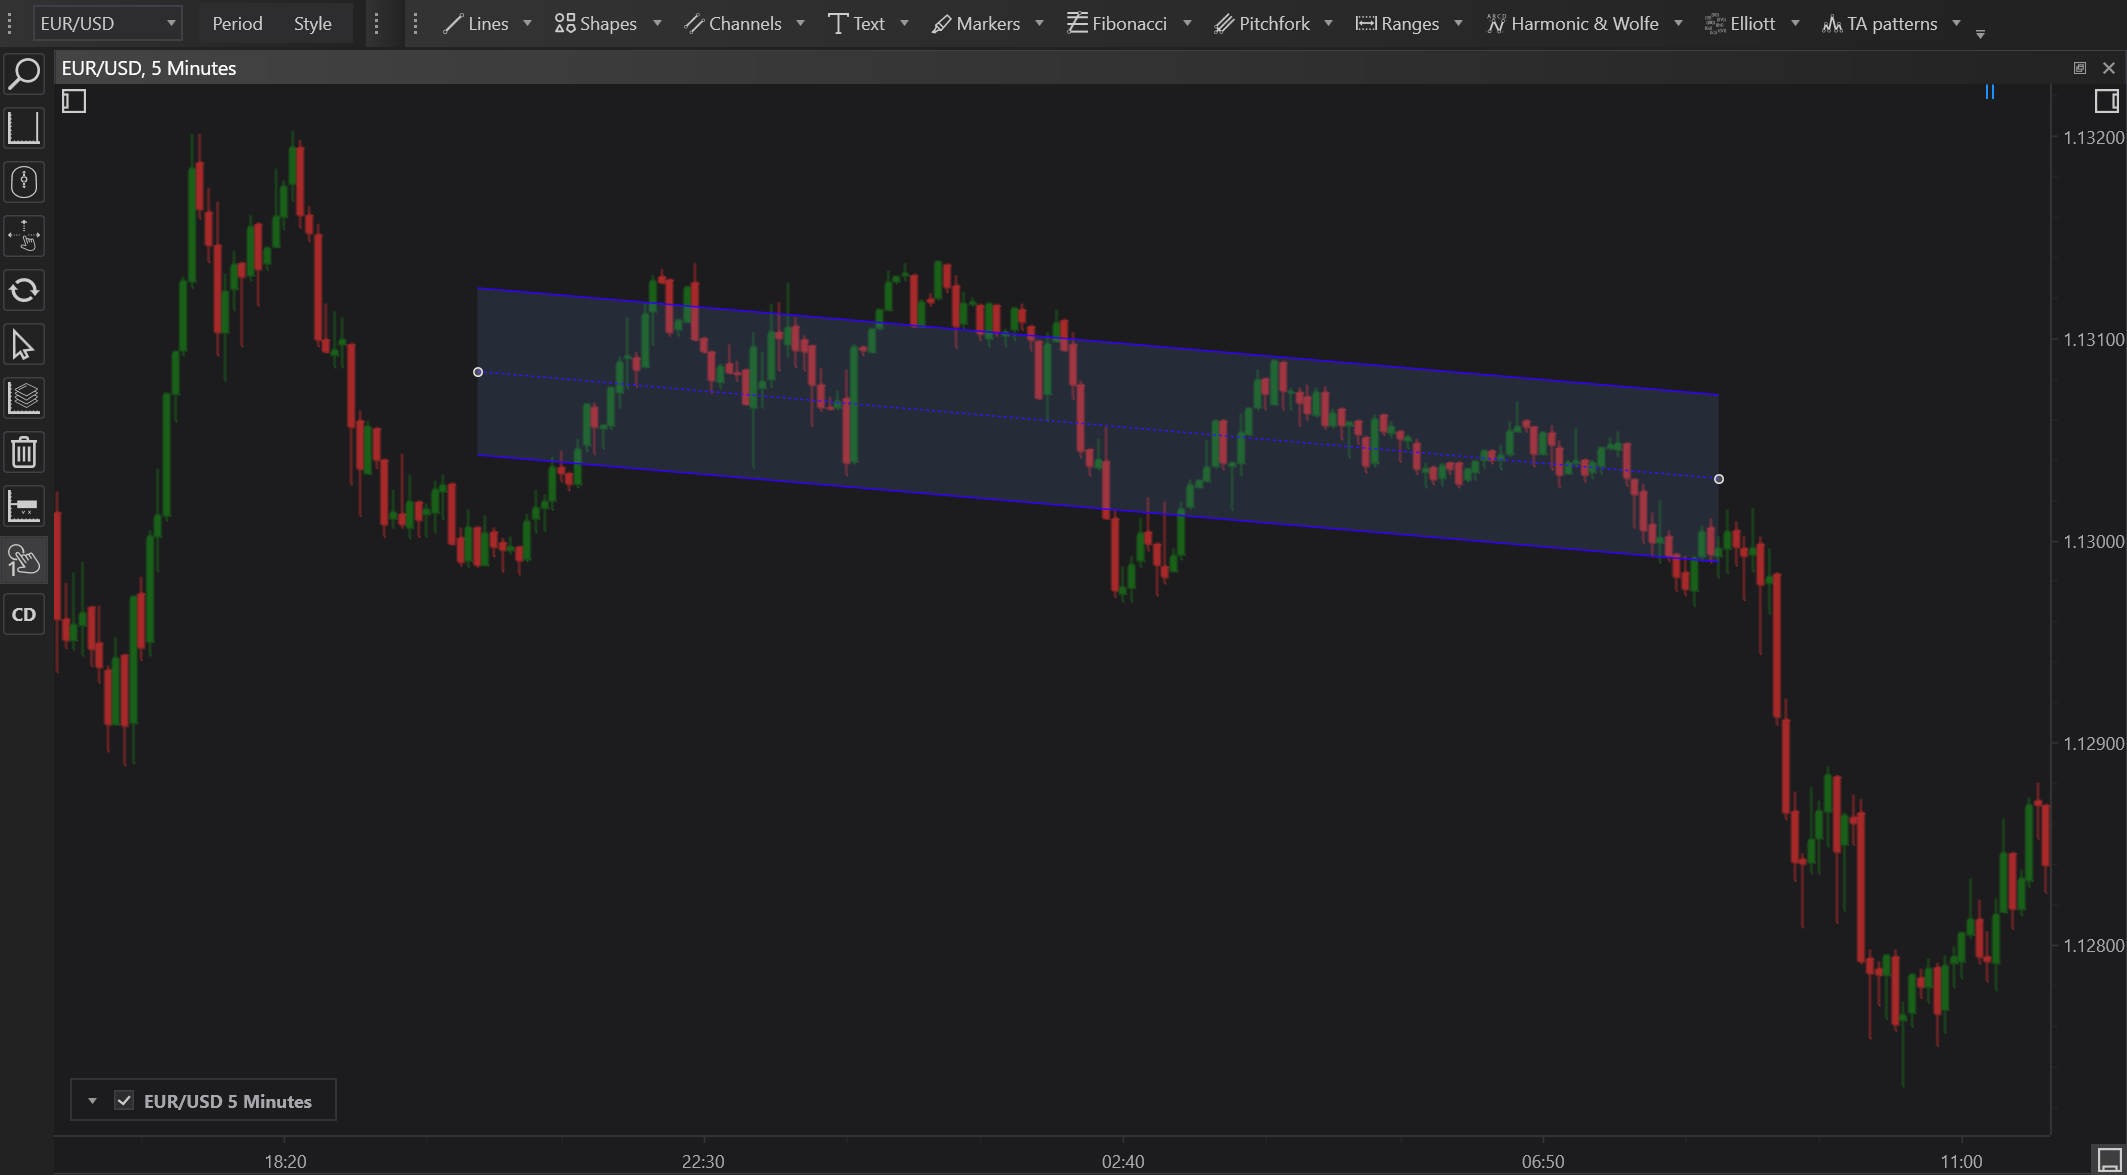
- Initial Placement: Click on the chart to determine the starting point of the analysis period, then drag to set the endpoint, defining the data range for the regression.
- Adjustment and Calibration: The channel automatically calculates and plots a regression line with standard deviation bands around it. Adjust the number of standard deviations to include based on desired sensitivity.
- Customization: Modify the appearance, including line thickness, color, and opacity, to differentiate the channel from other chart elements.
Features
- Volatility Insights: The width of the channels indicates the level of volatility, with wider channels representing greater price variability.
- Dynamic Adaptation: As new data becomes available, the channel updates in real-time, keeping the analysis relevant.
- Predictive Power: Offers predictive insights into price movements, suggesting possible upper and lower bounds based on historical volatility.
- Customization Options: Traders can set the number of standard deviations to adjust the sensitivity of the channel to price movements.
Practical Applications
- Volatility Assessment: Traders can assess the risk associated with a particular asset by observing the width of the channel; wider channels suggest higher volatility.
- Price Targeting: The upper and lower bands can serve as potential targets for taking profits or placing stops, depending on the market conditions.
- Trend Validation: Consistent trading within the bands can validate the strength of a trend, while a breakout might indicate a potential trend reversal or acceleration.
Benefits
- Enhanced Market Understanding: Provides a clear visual representation of both trend direction and the volatility surrounding that trend.
- Strategic Decision Making: Helps in making informed decisions by identifying potential reversal points and areas of price consolidation.
- Statistical Rigor: Utilizes standard deviation, a fundamental statistical measure, to give a quantifiable measure of dispersion and market sentiment.
Conclusion
The Standard Deviation Regression Channel is a sophisticated analytical tool in FinStudio that offers traders a deeper understanding of market dynamics. By quantifying the variability around a regression trendline, it not only aids in identifying the main trend but also provides crucial insights into the volatility patterns of the market. This channel is particularly useful for traders who rely on statistical methods to inform their trading strategies, providing a clear framework for managing risk and capitalizing on price movements.