Overview
The Gartley Pattern is a powerful trading tool in FinStudio that utilizes Fibonacci numbers to identify potential reversal points in the markets. This pattern is highly regarded among traders for its predictive accuracy and its ability to pinpoint entries with favorable risk-reward ratios.
Construction and Use
- Select the Tool: Access the drawing tools menu in FinStudio and select the Gartley Pattern tool.
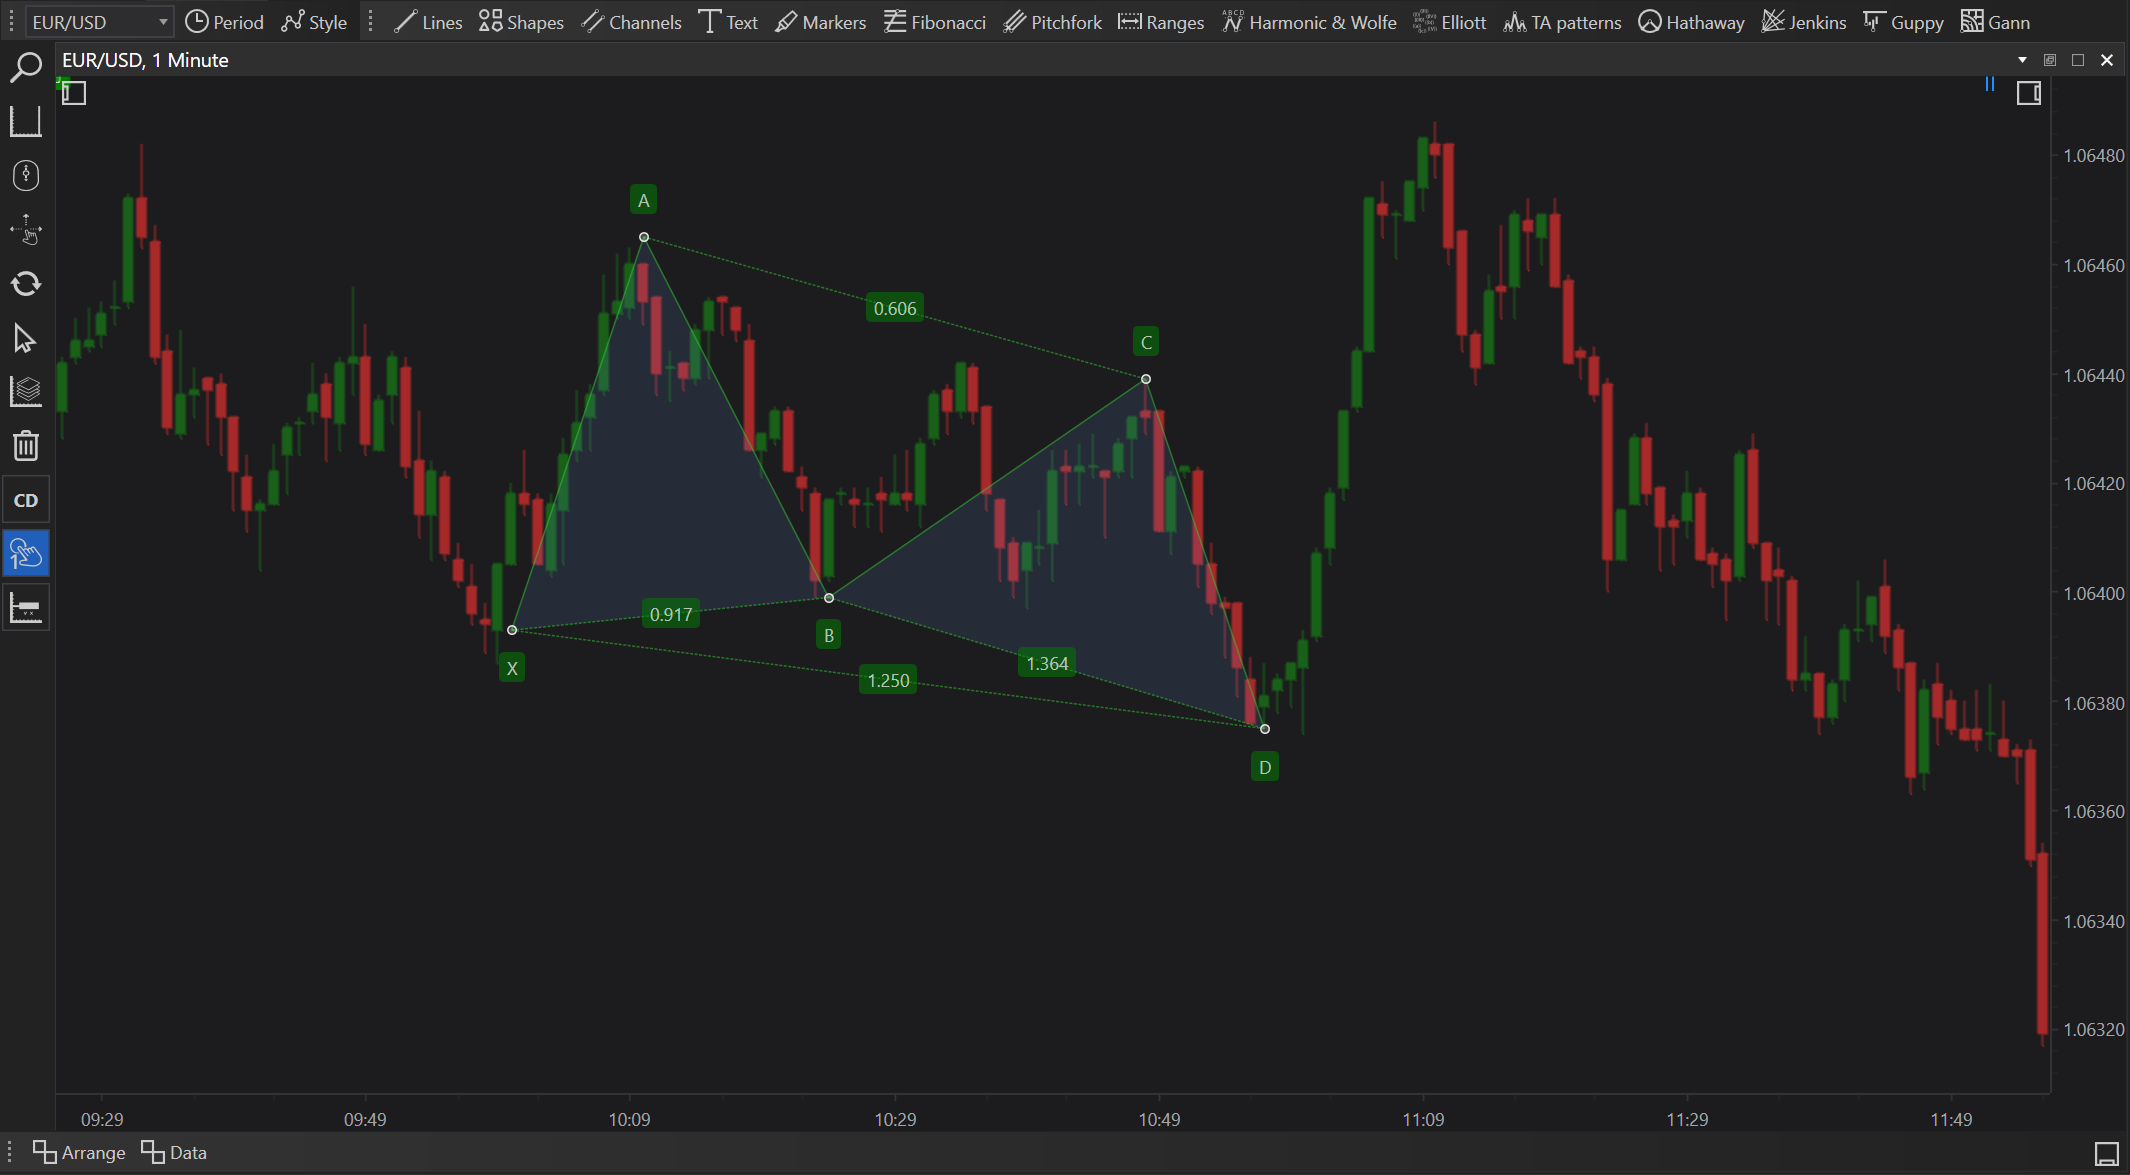
- Initial Placement: Click on the chart where you identify the start of a significant price movement, which serves as the X point of the pattern.
- Drawing the Pattern: Automatically generate the pattern by identifying subsequent significant price points—A, B, C, and D—according to Fibonacci retracement levels.
- Adjustment and Calibration: Fine-tune the points manually if needed to align precisely with price levels or to update the pattern based on new price data.
Features
- Fibonacci Ratios: Utilizes critical Fibonacci ratios to predict where the price is likely going, particularly focusing on the 61.8% and 38.2% retracement levels.
- Predictive Power: Capable of forecasting a reversal with considerable accuracy, which is critical for entering or exiting trades.
- Customization Options: Traders can modify the appearance, including line thickness, color, and transparency, to differentiate the pattern from other chart elements.
Practical Applications
- Trend Reversals: Ideal for spotting potential reversals in ongoing trends. The D point in the pattern indicates a strong area for potential reversals.
- Risk Management: Offers clear indications for setting stop-loss orders just beyond the D point, allowing for tight risk management.
- Profit Targets: Traders can set profit targets at key Fibonacci levels beyond the D point, optimizing potential returns.
Benefits
- Enhanced Market Timing: Provides traders with the ability to enter the market at points of low risk and high potential reward.
- Strategic Trade Planning: Helps in planning complex trade setups by clearly delineating entry and exit points based on historical price patterns.
- Educational Value: Offers insights into the application of Fibonacci numbers in trading, enhancing a trader’s analytical skills.
Conclusion
The Gartley Pattern tool in FinStudio is an essential feature for traders who focus on harmonic trading strategies. By integrating this tool into their market analysis, traders can enhance their ability to make informed decisions based on sophisticated pattern recognition and Fibonacci mathematics. This not only aids in identifying high-probability trading opportunities but also in executing trades with a clear understanding of potential market movements.