Introduction
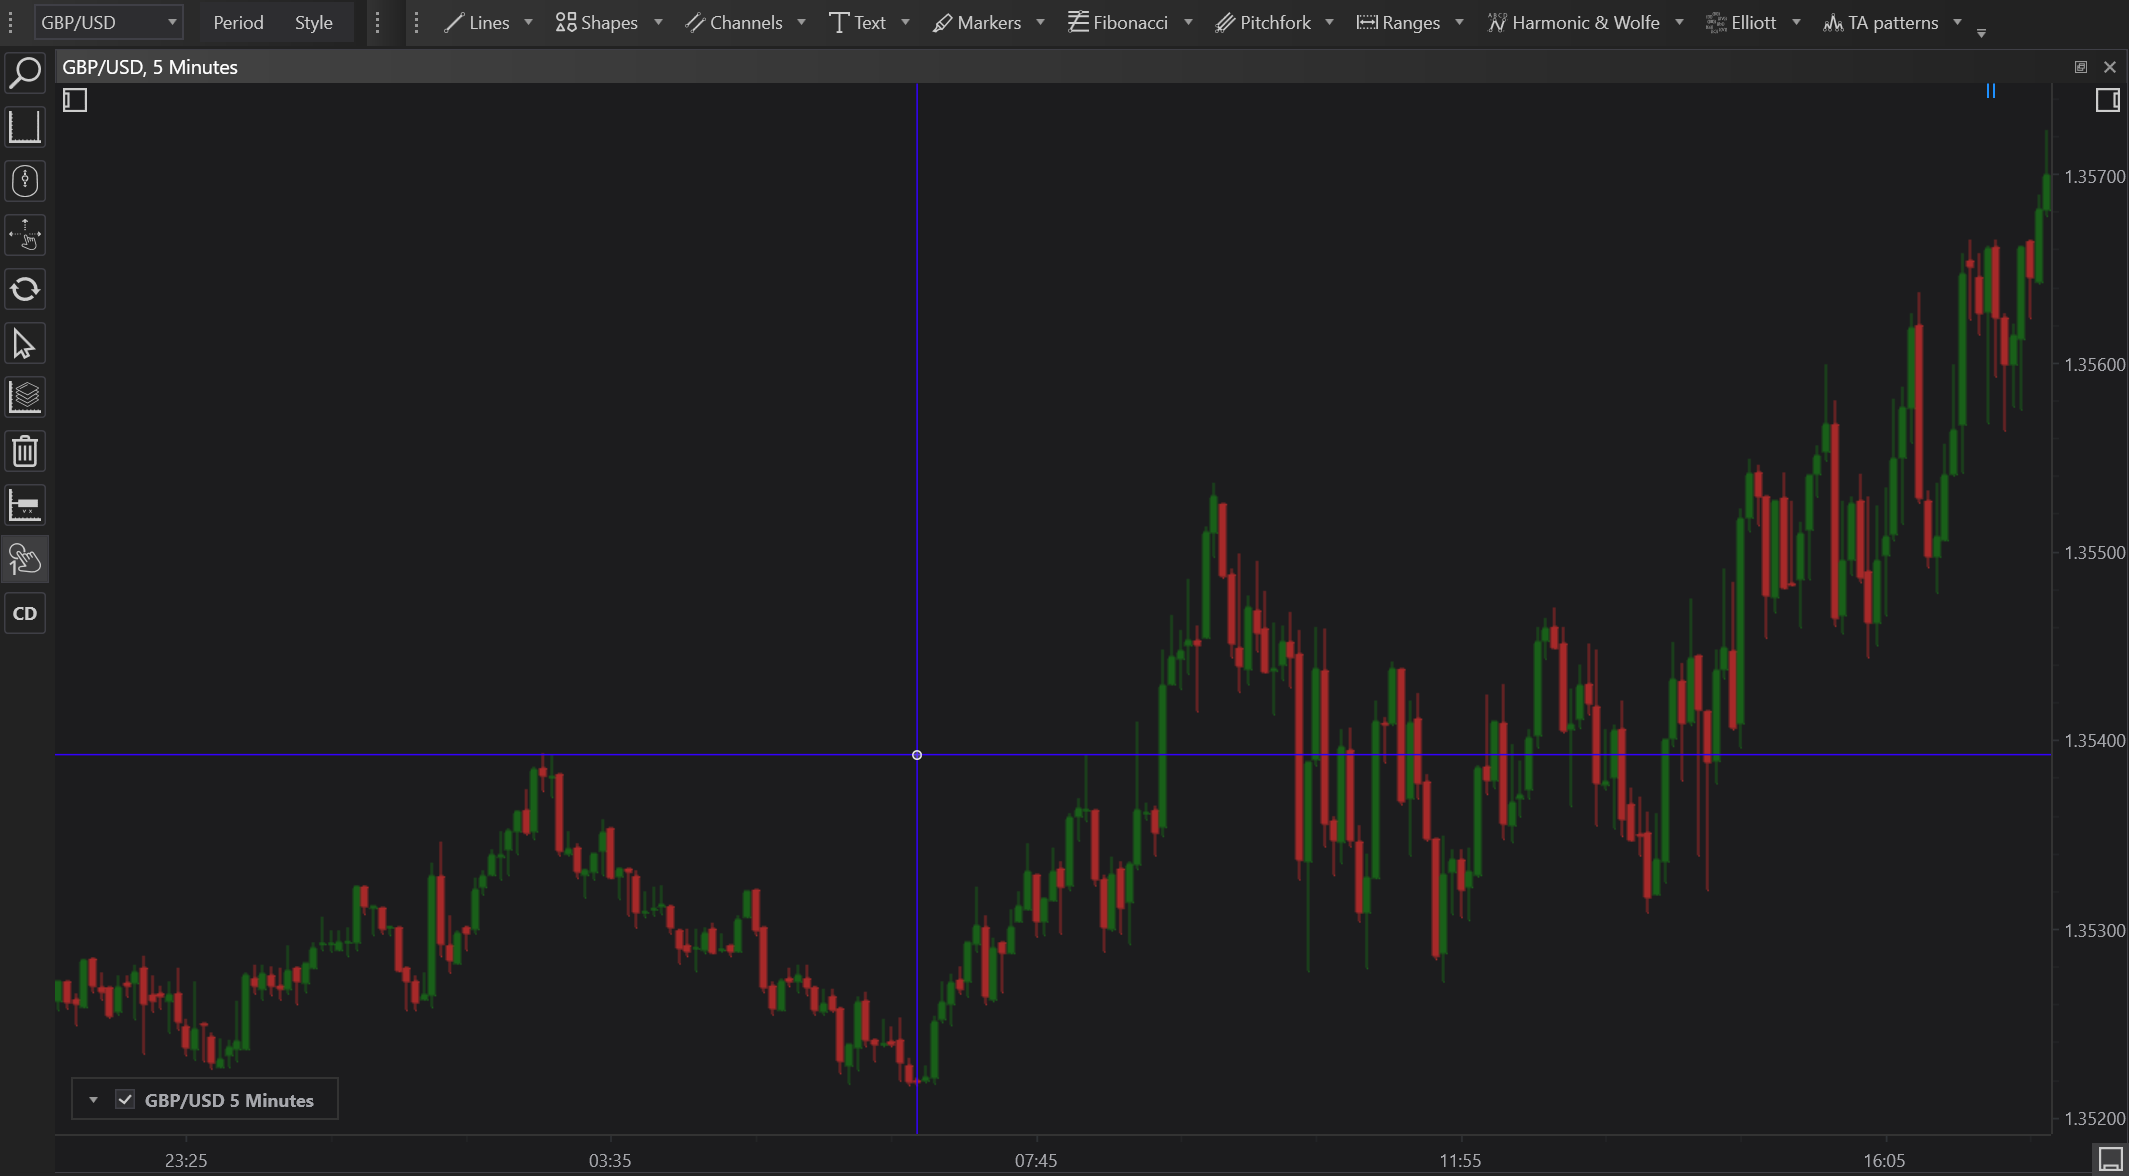
The Cross Line is an essential drawing tool in FinStudio that assists traders and analysts in pinpointing exact price and time coordinates on a trading chart. This tool is invaluable for illustrating precise intersections or significant moments in market activity.
Functionality
A Cross Line consists of two perpendicular lines intersecting at a chosen point on the chart, effectively marking the exact price and time location. This feature is crucial for detailed technical analysis, ensuring no ambiguity about the position being discussed or analyzed.
Applications
- Support and Resistance Identification: Mark exact points where the price has historically found support or resistance.
- Timing Confluence: Highlight specific times where important market events or price actions occurred, aiding in correlation analysis with other market data.
- Educational Purposes: Use in training materials to clearly demonstrate technical concepts or historical points of interest.
Setting Up
To implement a Cross Line on your chart:
- Select the Cross Line tool from the drawing tools menu.
- Click on the chart at the point where you want the lines to intersect, automatically drawing horizontal and vertical lines that cross at your chosen point.
Customization
The Cross Line can be customized in color and style (solid, dashed, dotted) to distinguish between different analytical observations or to match presentation themes.
Conclusion
The Cross Line tool is pivotal for traders who require exactness in marking specific points on a chart, especially when discussing strategies that hinge on precise price levels and timings. Its ability to clearly mark intersections makes it a favorite for both detailed analysis and educational content.