Introduction
The Extended Line tool in FinStudio serves as a versatile instrument in the arsenal of financial chartists and analysts. Unlike traditional lines that are confined to specific start and end points, the Extended Line extends infinitely in both directions, offering an unbroken view of potential trends and alignments across the chart.
Functionality
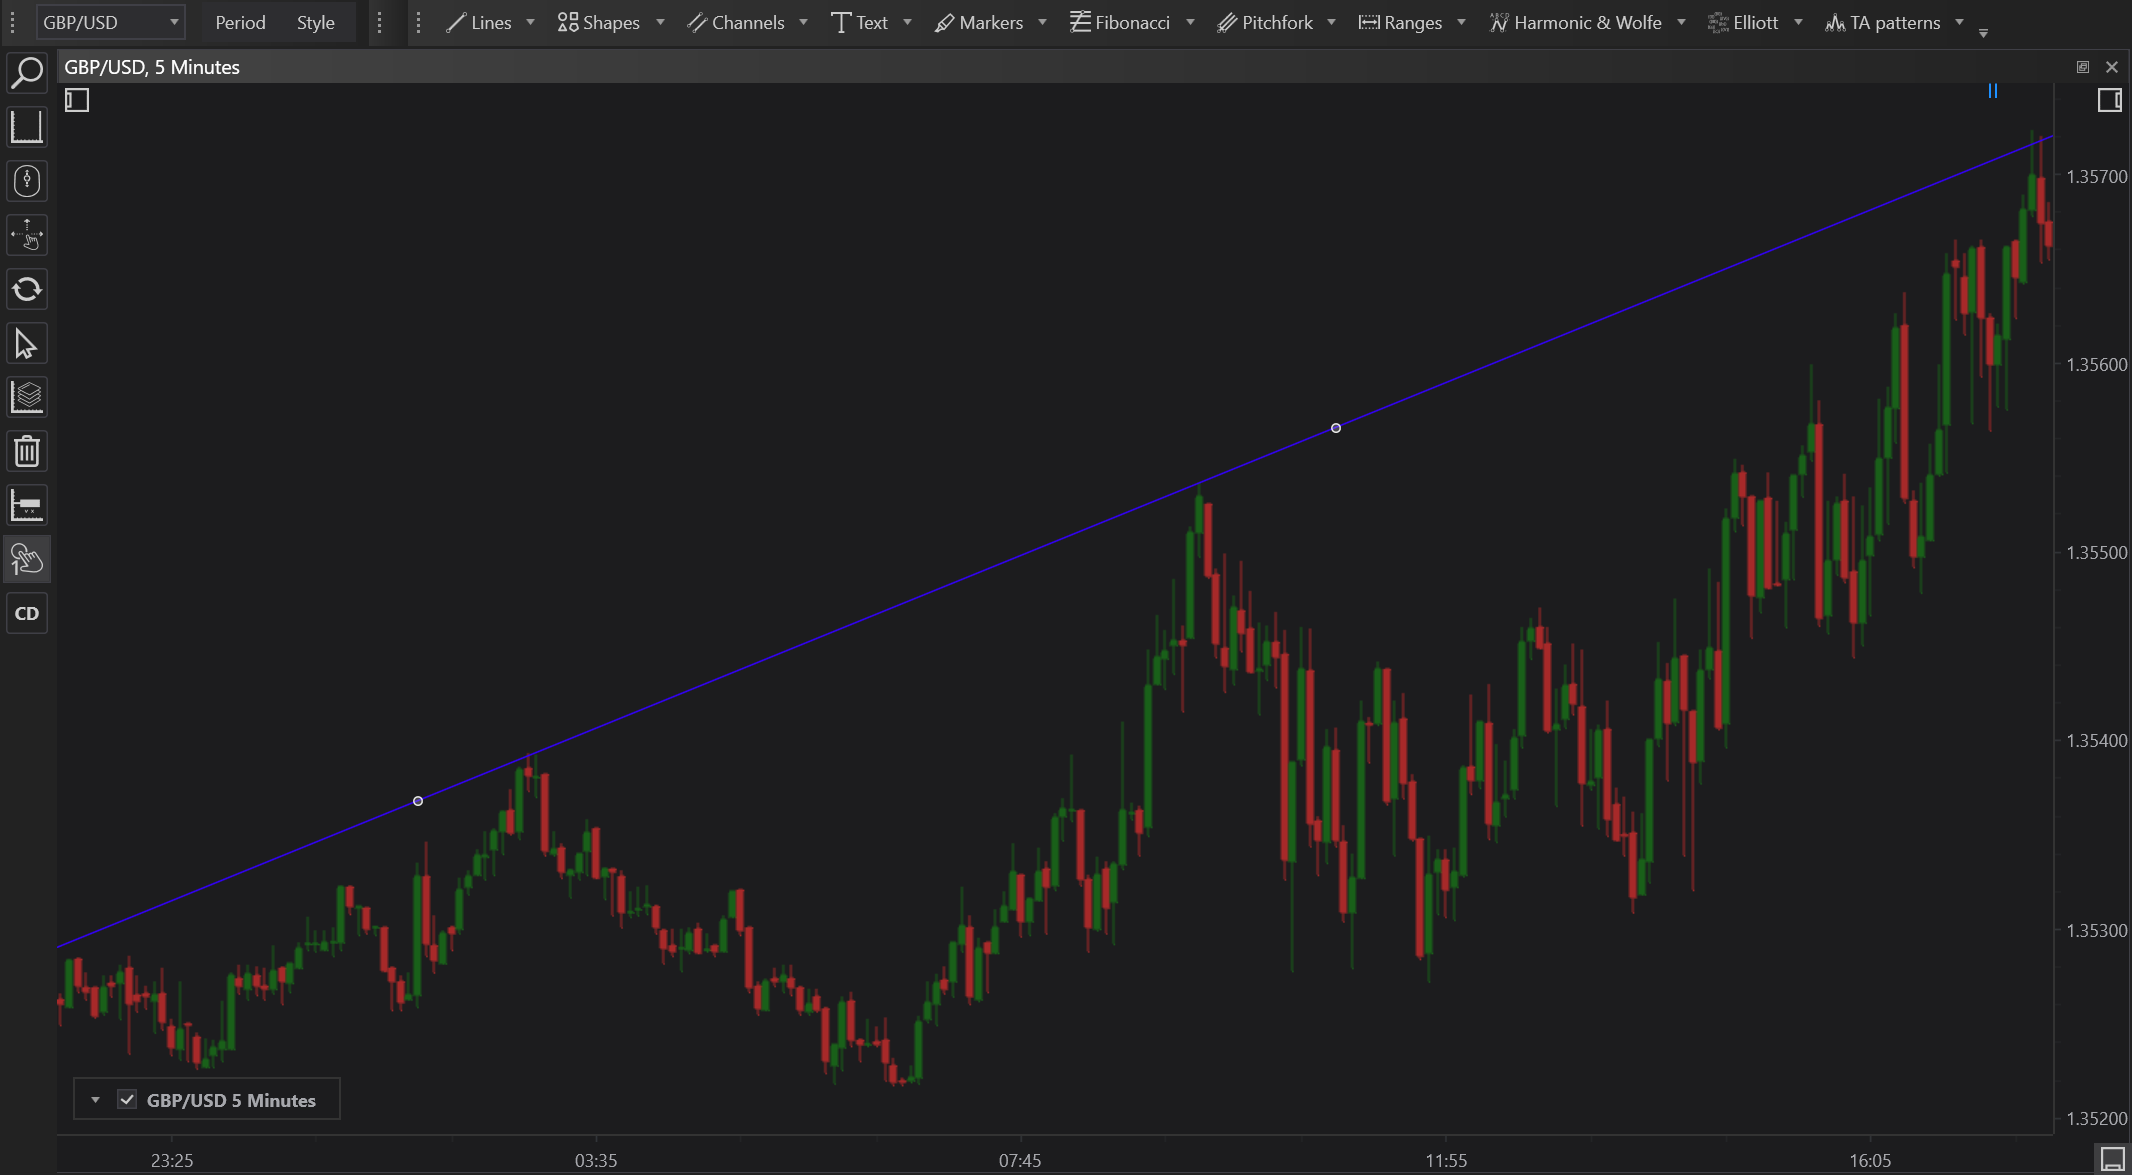
The Extended Line tool creates a straight line that runs indefinitely across the entire chart pane. This characteristic is particularly useful for illustrating long-term trends and potential areas of support or resistance that extend beyond the visible timeframe.
Applications
- Trend Identification: Easily draw trend lines that continue beyond the immediate viewing area, helping to visualize extended market directions.
- Future Projections: By extending into future areas of the chart, this line can help forecast potential price paths.
- Historical Analysis: Analyze long-term trends by extending the line back across historical data without the need to adjust or redraw the line as new data appears.
Setting Up
To add an Extended Line to your chart:
- Select the Extended Line tool from the drawing tools panel.
- Click and drag on the chart to define the direction and slope of the line. Once set, the line will automatically extend across the entire chart area.
Customization
Extended Lines can be customized in terms of color, thickness, and line style (e.g., solid, dashed, or dotted), allowing analysts to apply personal or organizational charting standards and improve visual distinction.
Conclusion
The Extended Line is an indispensable tool for those who engage in technical analysis, providing a clear and continuous perspective on price movements. Its ability to extend infinitely makes it ideal for both retrospective assessments and forward-looking projections, ensuring that users are well-equipped to handle comprehensive data analysis with ease.