Introduction
The Horizontal Line is a fundamental tool in chart analysis, used across various financial markets to mark specific price levels on a chart. This tool is indispensable for highlighting areas of support and resistance, price targets, and significant historical price levels.
Functionality
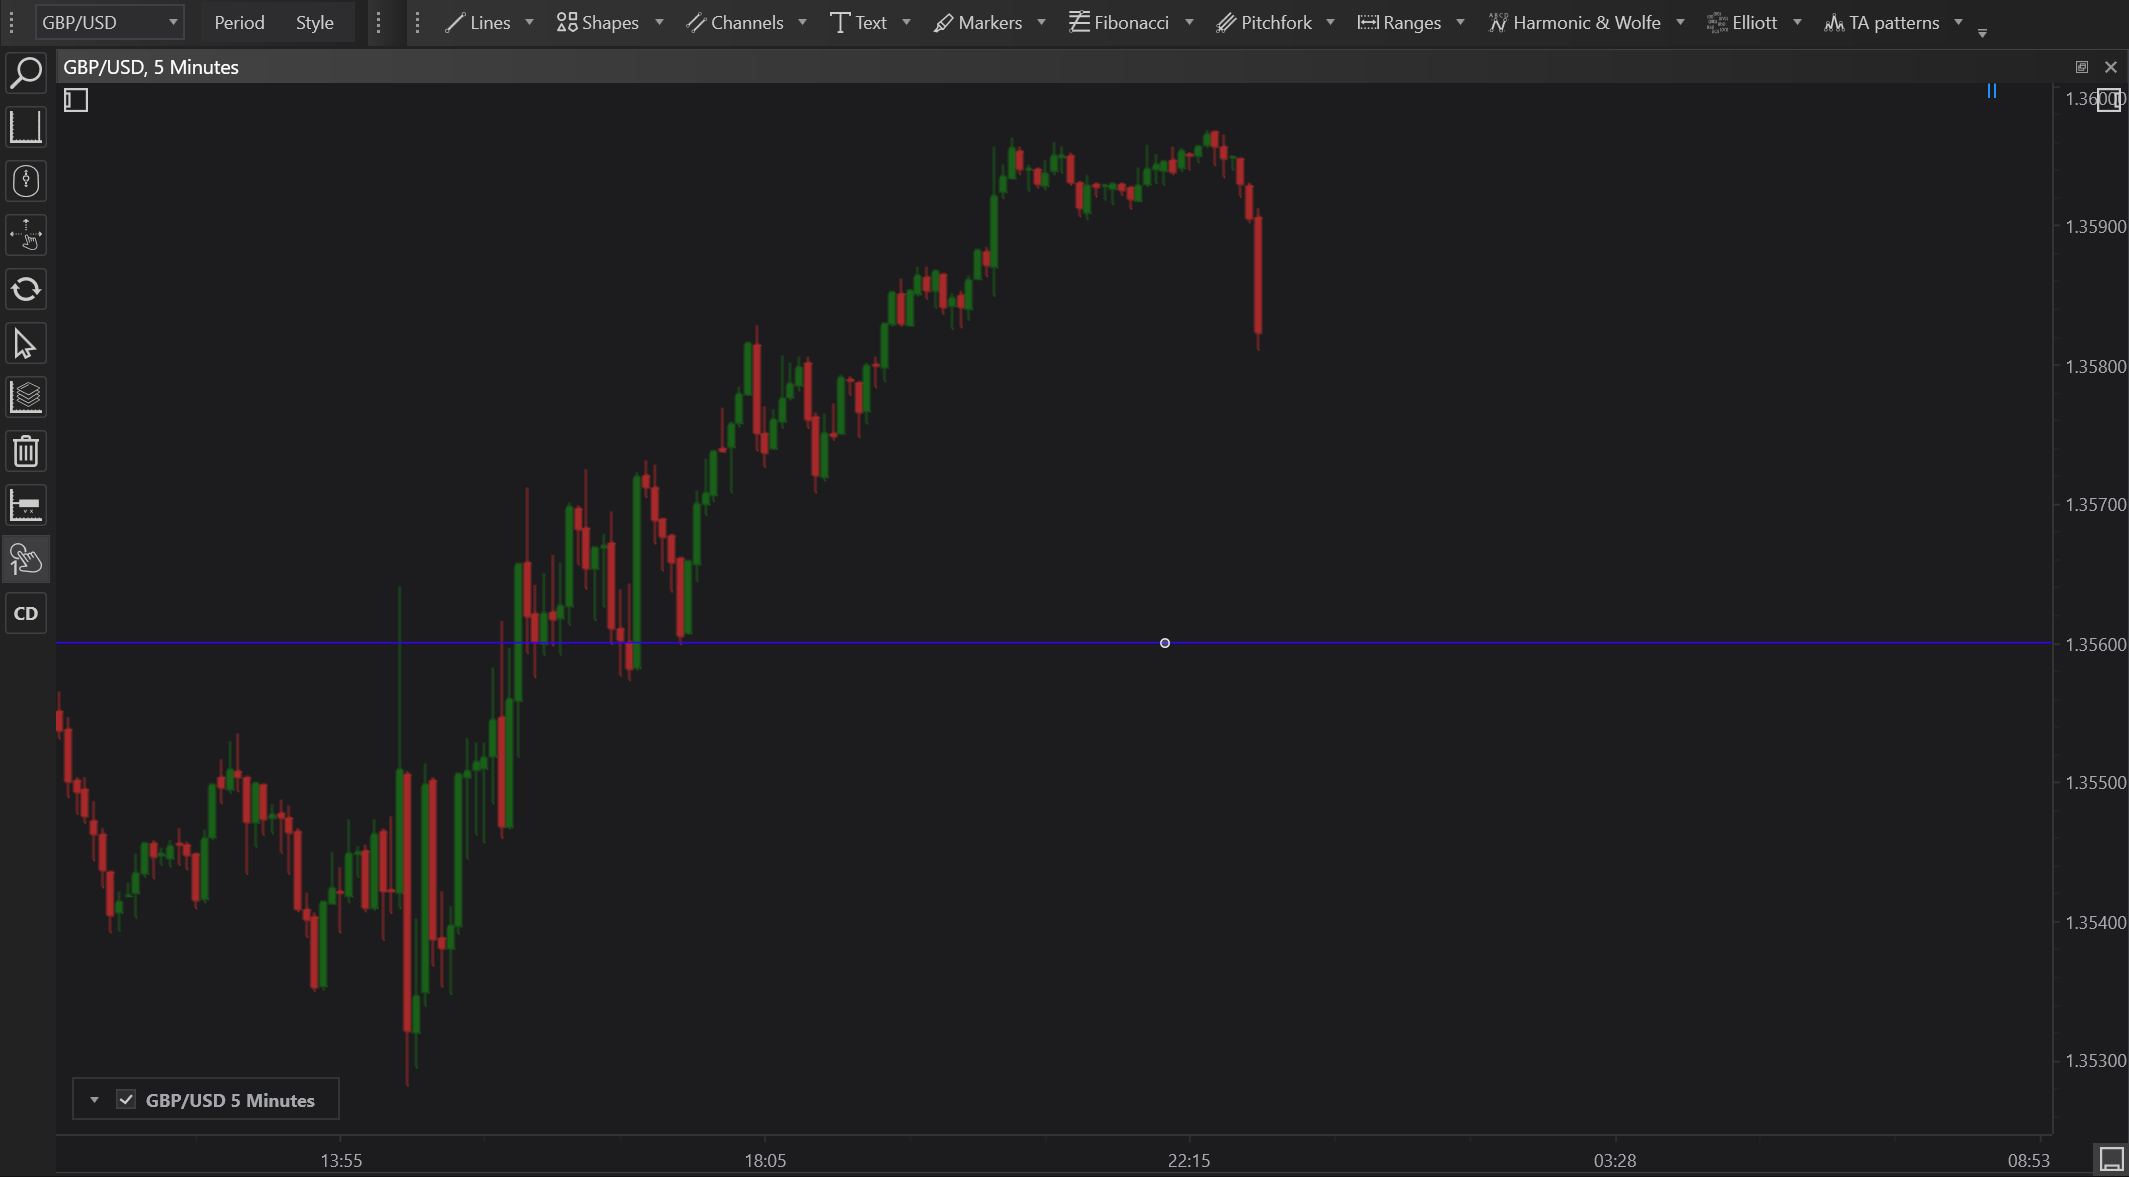
A Horizontal Line is drawn at a precise price level and extends across the entire width of the chart. This line serves as a clear marker for specific prices and remains static, regardless of changes in the chart's time scale or zoom level.
Applications
- Support and Resistance Levels: Mark areas where the price has historically found support or resistance, helping to predict future market behavior at these levels.
- Psychological Price Levels: Highlight round numbers or significant historical highs and lows, which can act as psychological barriers in price movement.
- Risk Management: Set visual markers for stop-loss or take-profit levels, aiding in the enforcement of disciplined trading strategies.
Setting Up
To implement a Horizontal Line on your chart:
- Choose the Horizontal Line tool from the drawing tools menu.
- Click on the chart where you want the line to appear. The line will automatically align horizontally based on the price level at the point of clicking.
Customization
The line can be customized to different colors, styles, and thicknesses to differentiate various types of lines or to match personal or institutional preferences, enhancing readability and utility.
Conclusion
The Horizontal Line tool is a simple yet powerful feature in FinStudio, providing clarity and precision in market analysis. By offering a visual representation of significant price levels, it assists traders and analysts in making informed decisions based on key price points, enhancing both the analysis and execution of trading strategies.