Introduction
The Horizontal Ray tool is a specialized line tool used in financial charting to mark a specific price level extending indefinitely from a chosen point to the right side of the chart. This tool is particularly useful for identifying support and resistance levels that extend into the future without cluttering the entire chart history.
Functionality
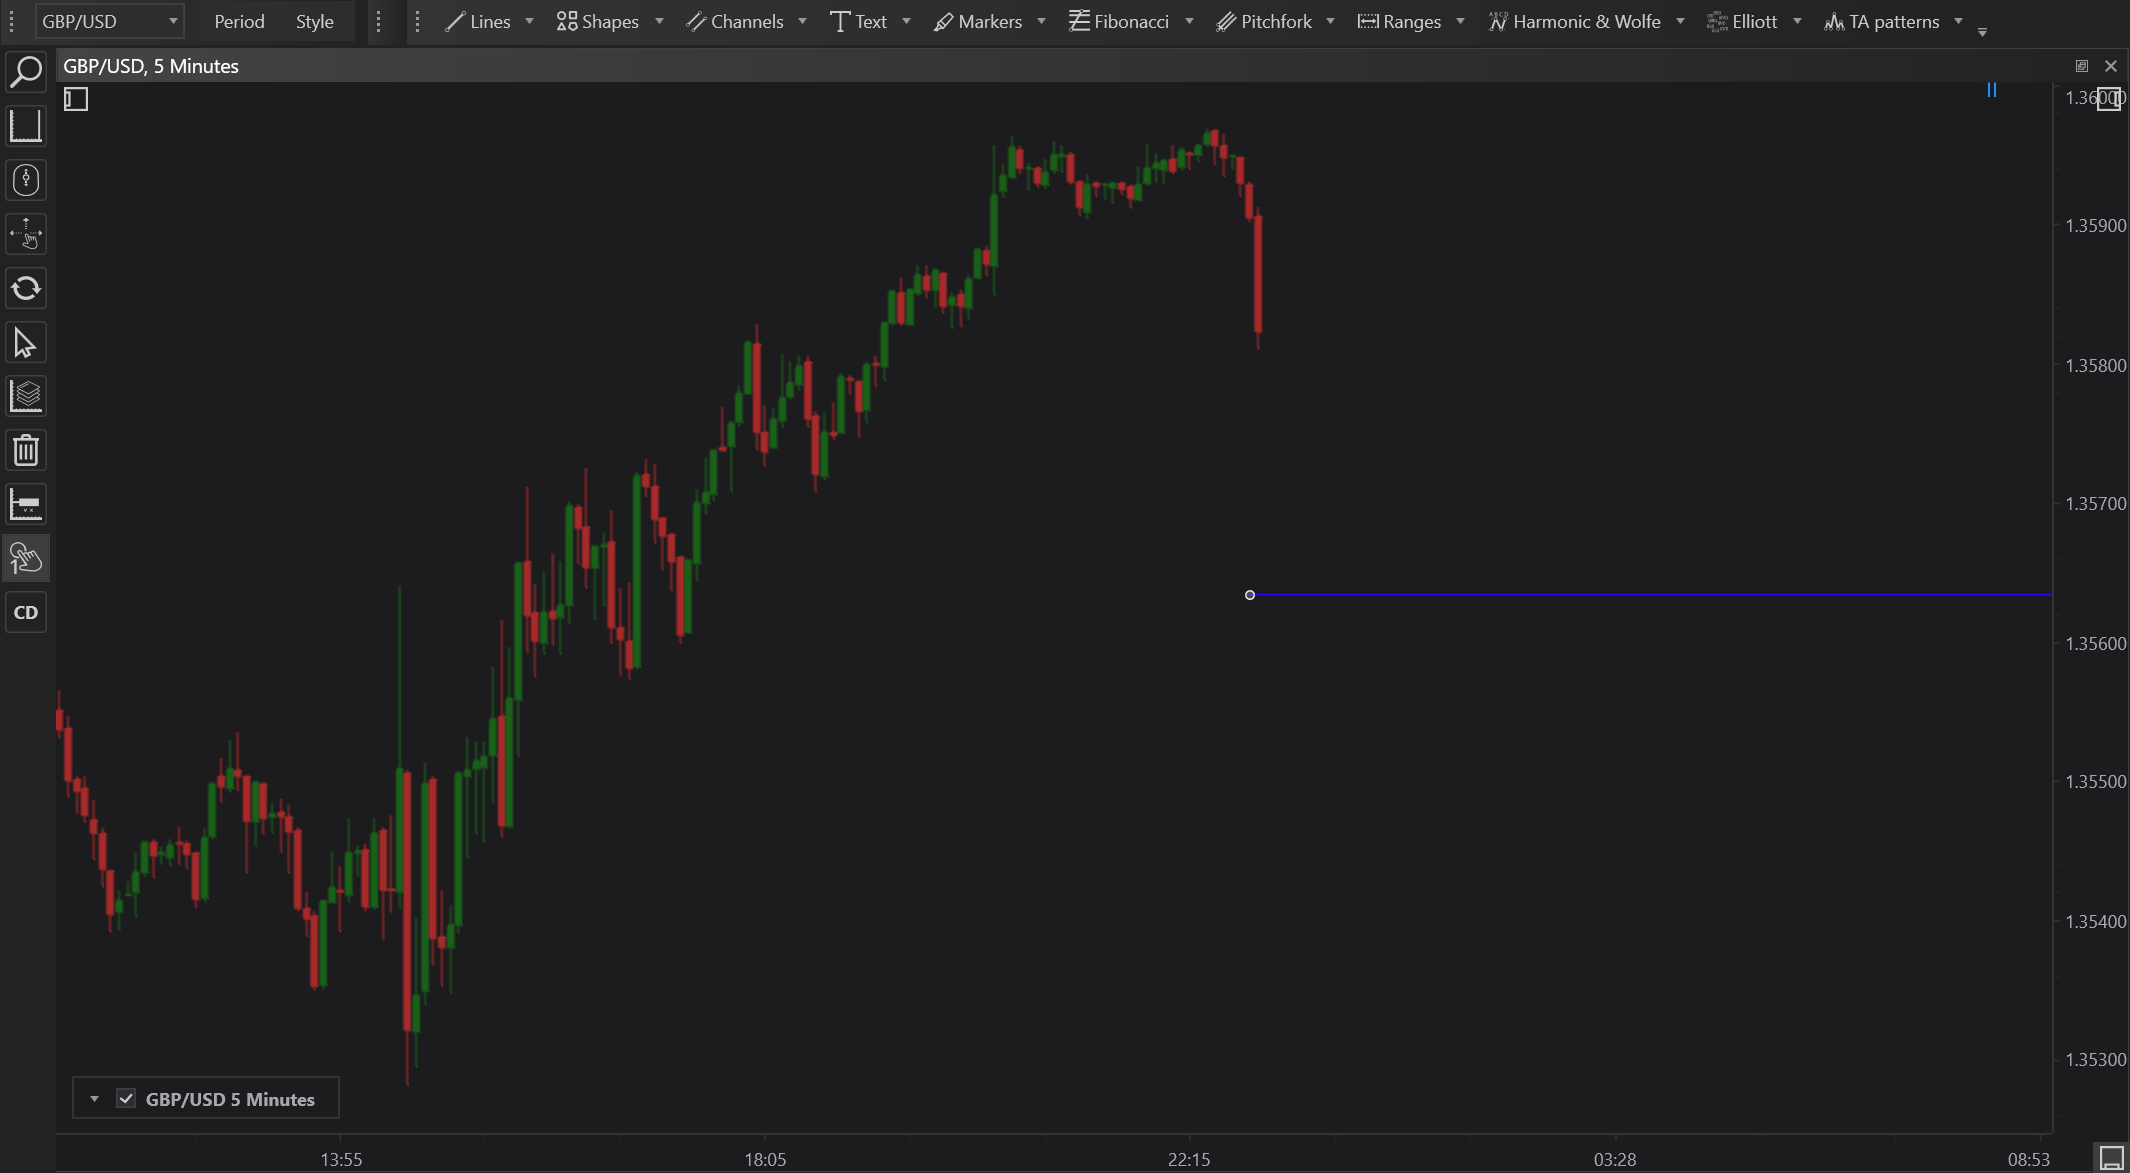
A Horizontal Ray is similar to a horizontal line but differs primarily in its extension. While a horizontal line spans the entire width of the chart, a horizontal ray begins at a specific point and extends infinitely to the right, reflecting the continuation of a price level.
Applications
- Support and Resistance Identification: It helps in marking potential support or resistance levels that traders anticipate will influence future price actions.
- Breakout Confirmation: Used to mark levels where a price breakout could occur, providing a clear visual cue when prices cross these key levels.
- Trend Confirmation: Helps in confirming the sustainability of a trend as prices stay above or below a significant price level indicated by the ray.
Setting Up
To use a Horizontal Ray:
- Select the Horizontal Ray tool from the drawing tools menu.
- Click on the chart at the price level where you want the ray to start. The ray will appear, extending to the right of the chart.
Customization
Horizontal Rays can be customized in color, style, and thickness to suit different analytical needs or visual preferences, making it easier to distinguish between various analytical points on the chart.
Conclusion
The Horizontal Ray tool in FinStudio simplifies the process of tracking price levels across time without overcrowding the chart. By providing a clear, ongoing reference point, it assists traders in monitoring specific price actions and making strategic decisions based on the continuation of identified price levels. Its straightforward application and clear visual representation make it an essential tool for technical analysts and traders aiming for precision in long-term price level monitoring.