Introduction
The Multi-Point Line is an adaptable drawing tool in technical analysis that connects various price points across a chart. This tool is instrumental in identifying and highlighting complex price patterns or trends that are not strictly horizontal or vertical.
Functionality
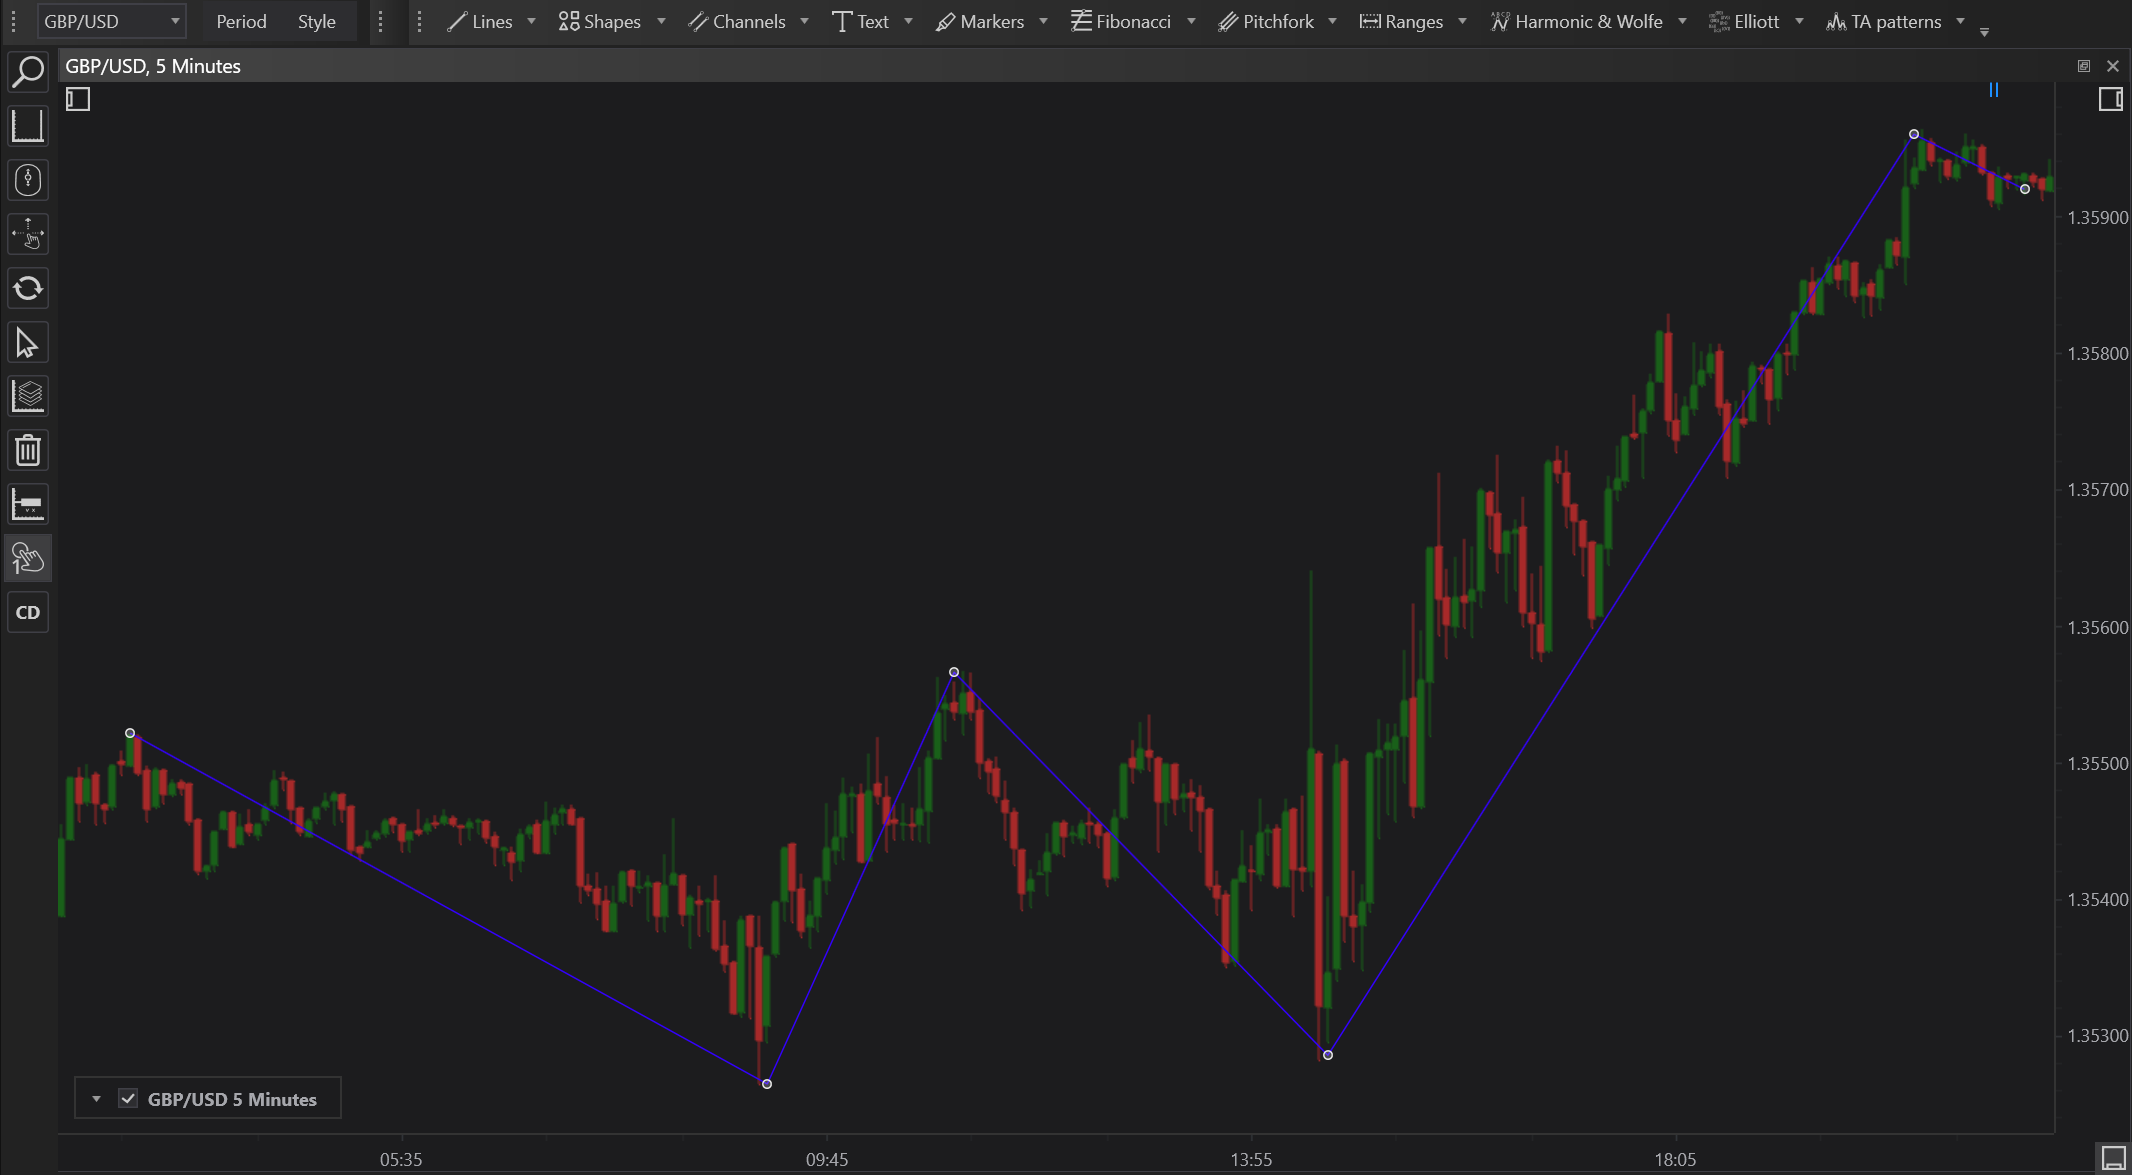
Unlike simpler line tools that connect two points, the Multi-Point Line allows for the connection of multiple points on a chart. This flexibility makes it possible to outline irregular or intricate price movements and trend lines over time.
Applications
- Trend Identification: By connecting multiple peaks or troughs, traders can use Multi-Point Lines to delineate complex trends, helping in the visualization of both upward and downward market directions.
- Pattern Recognition: This tool is crucial in spotting sophisticated formations and patterns in the market, such as channels, wedges, or more irregular formations that might not be immediately apparent.
- Strategic Planning: Traders utilize these lines to identify potential areas of support and resistance that occur at various points along a trend, aiding in strategic decision-making for entry and exit points.
Setting Up
To draw a Multi-Point Line:
- Select the Multi-Point Line tool from the drawing tools menu.
- Click on the chart to place the initial point.
- Continue clicking at various other significant price points to extend the line.
- Double-click or press 'Enter' to complete the line.
Customization
Multi-Point Lines can be customized in terms of color, thickness, and line style (dotted, dashed, solid). These customization options help in distinguishing between different types of lines used on the same chart, enhancing clarity and readability.
Conclusion
The Multi-Point Line is a versatile tool in technical analysis, providing detailed insights into complex market trends and patterns. Its ability to connect multiple points across a chart makes it invaluable for traders who engage with dynamic and rapidly changing market environments. By utilizing this tool, traders can enhance their understanding of market movements and refine their trading strategies accordingly.