Introduction
The Ray Line is a dynamic drawing tool used in technical analysis to project the continuation of a trend from a specific starting point indefinitely into the future. This tool is invaluable for visualizing potential future price movements based on current or historical price trends.
Functionality
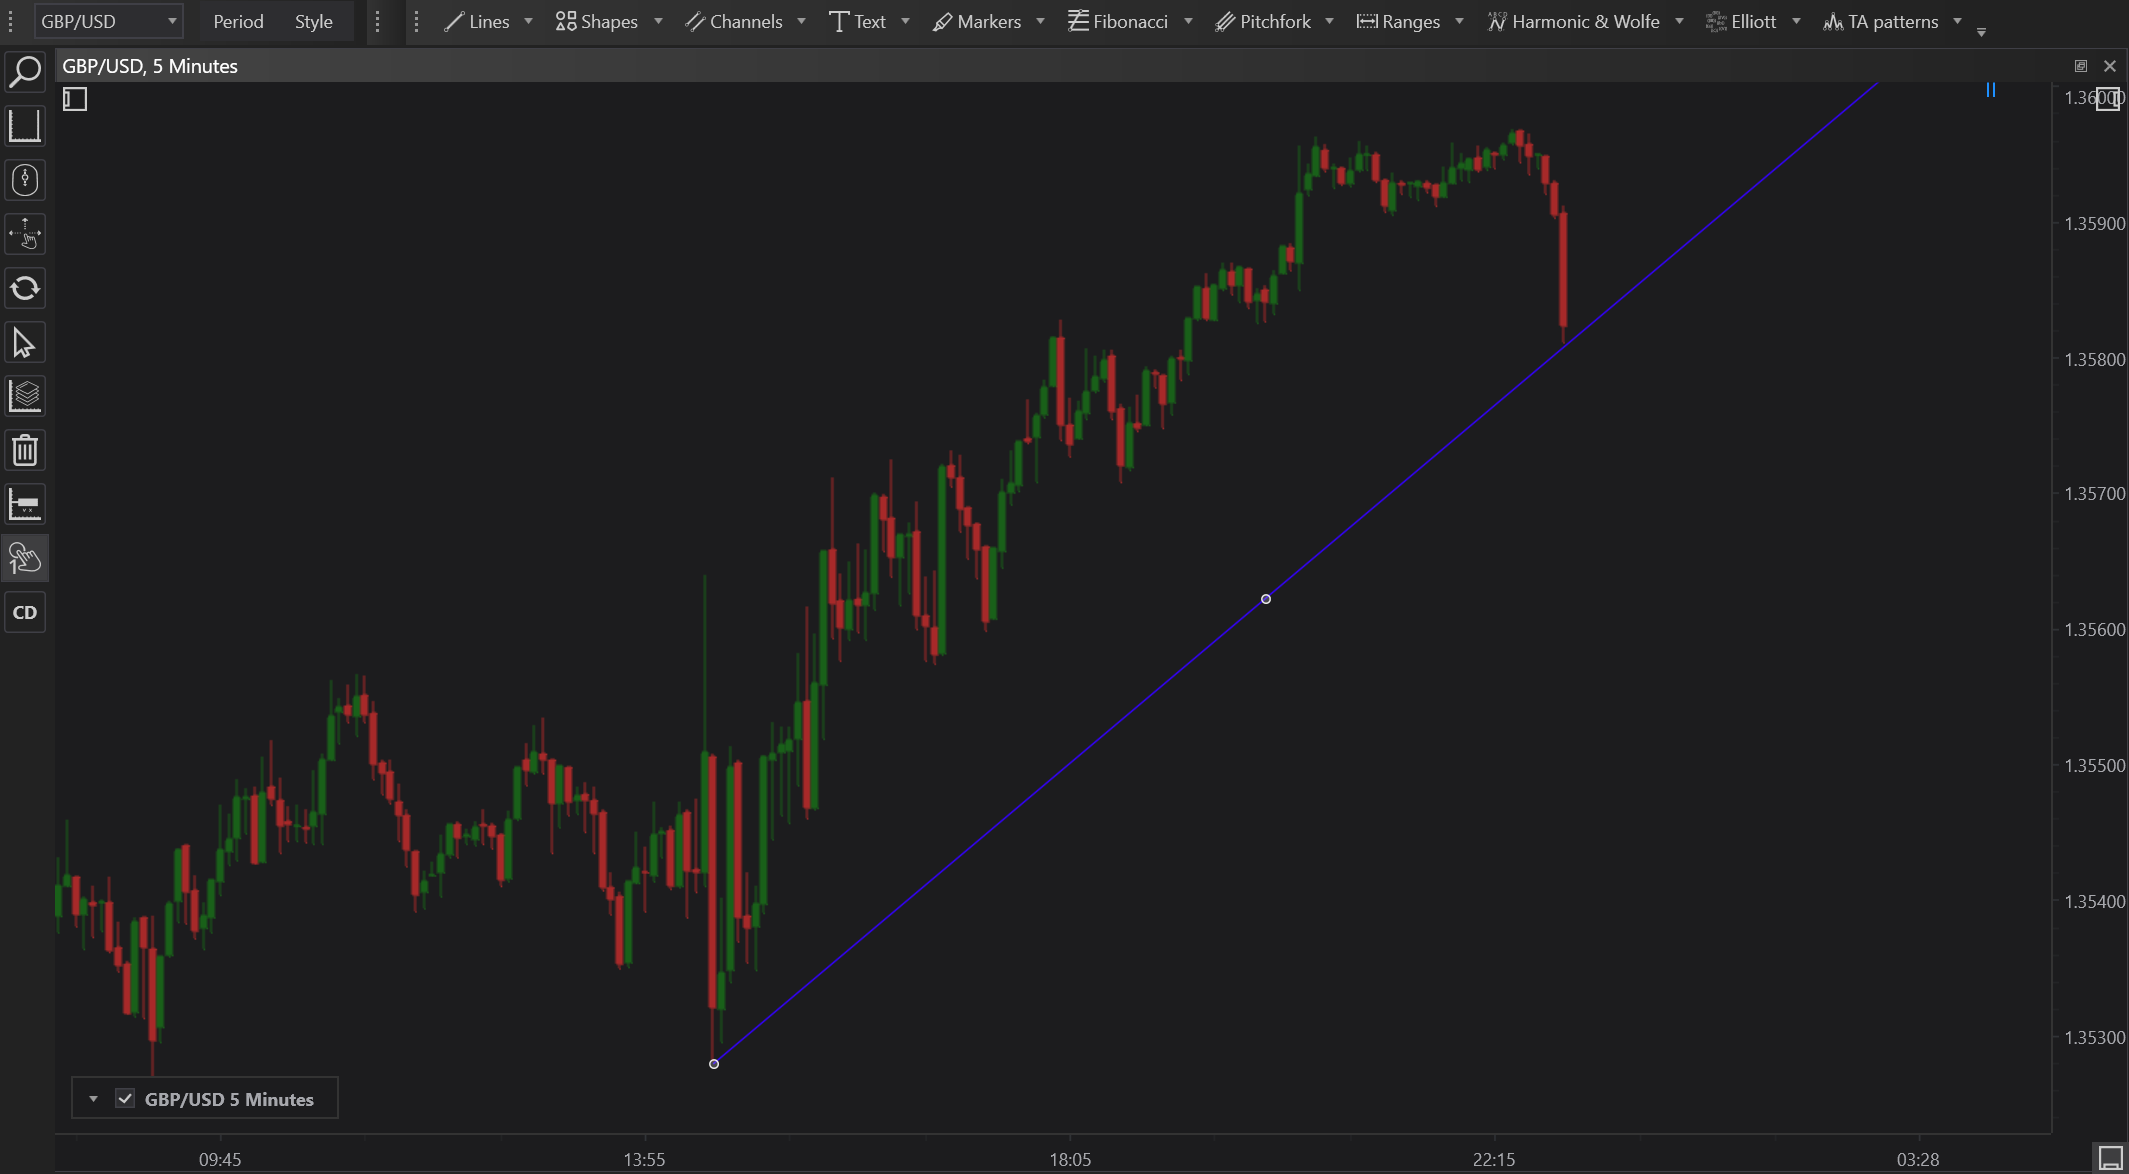
A Ray Line extends from a chosen starting point and continues infinitely in one direction. It helps in establishing a clear trajectory of an upward or downward trend based on pivotal market points like highs or lows.
Applications
- Trend Projection: Ray Lines are primarily used to project future price directions, helping traders to visualize where the price might head if a current trend continues unabated.
- Resistance and Support: These lines can be drawn to pass through historical highs or lows to indicate potential resistance or support levels that may reoccur.
- Strategic Planning: Traders often use Ray Lines to determine optimal points for trade entries and exits, based on the anticipated continuation of a trend.
Setting Up
To draw a Ray Line:
- Select the Ray Line tool from the charting toolbar.
- Click on the chart where you wish the line to begin.
- Drag the line in the direction you predict the trend will continue and release.
- The line will automatically extend infinitely in that direction.
Customization
Ray Lines can be customized for color, opacity, and line style. This allows traders to differentiate between various trend lines used in their analysis, making the charts easier to interpret.
Conclusion
The Ray Line is a straightforward yet powerful tool in the arsenal of technical analysts. It aids in the visualization of the extension of trends into the future, providing a clear path for anticipated price movements. This can be particularly useful in markets known for sustained trends, allowing traders to plan their strategies over the longer term with greater confidence.