Introduction
The Vertical Line is a straightforward yet indispensable tool in technical analysis, used by traders to mark specific time points on trading charts. This tool helps in highlighting significant events, identifying cycles, and organizing the visual representation of time-related data on price charts.
Functionality
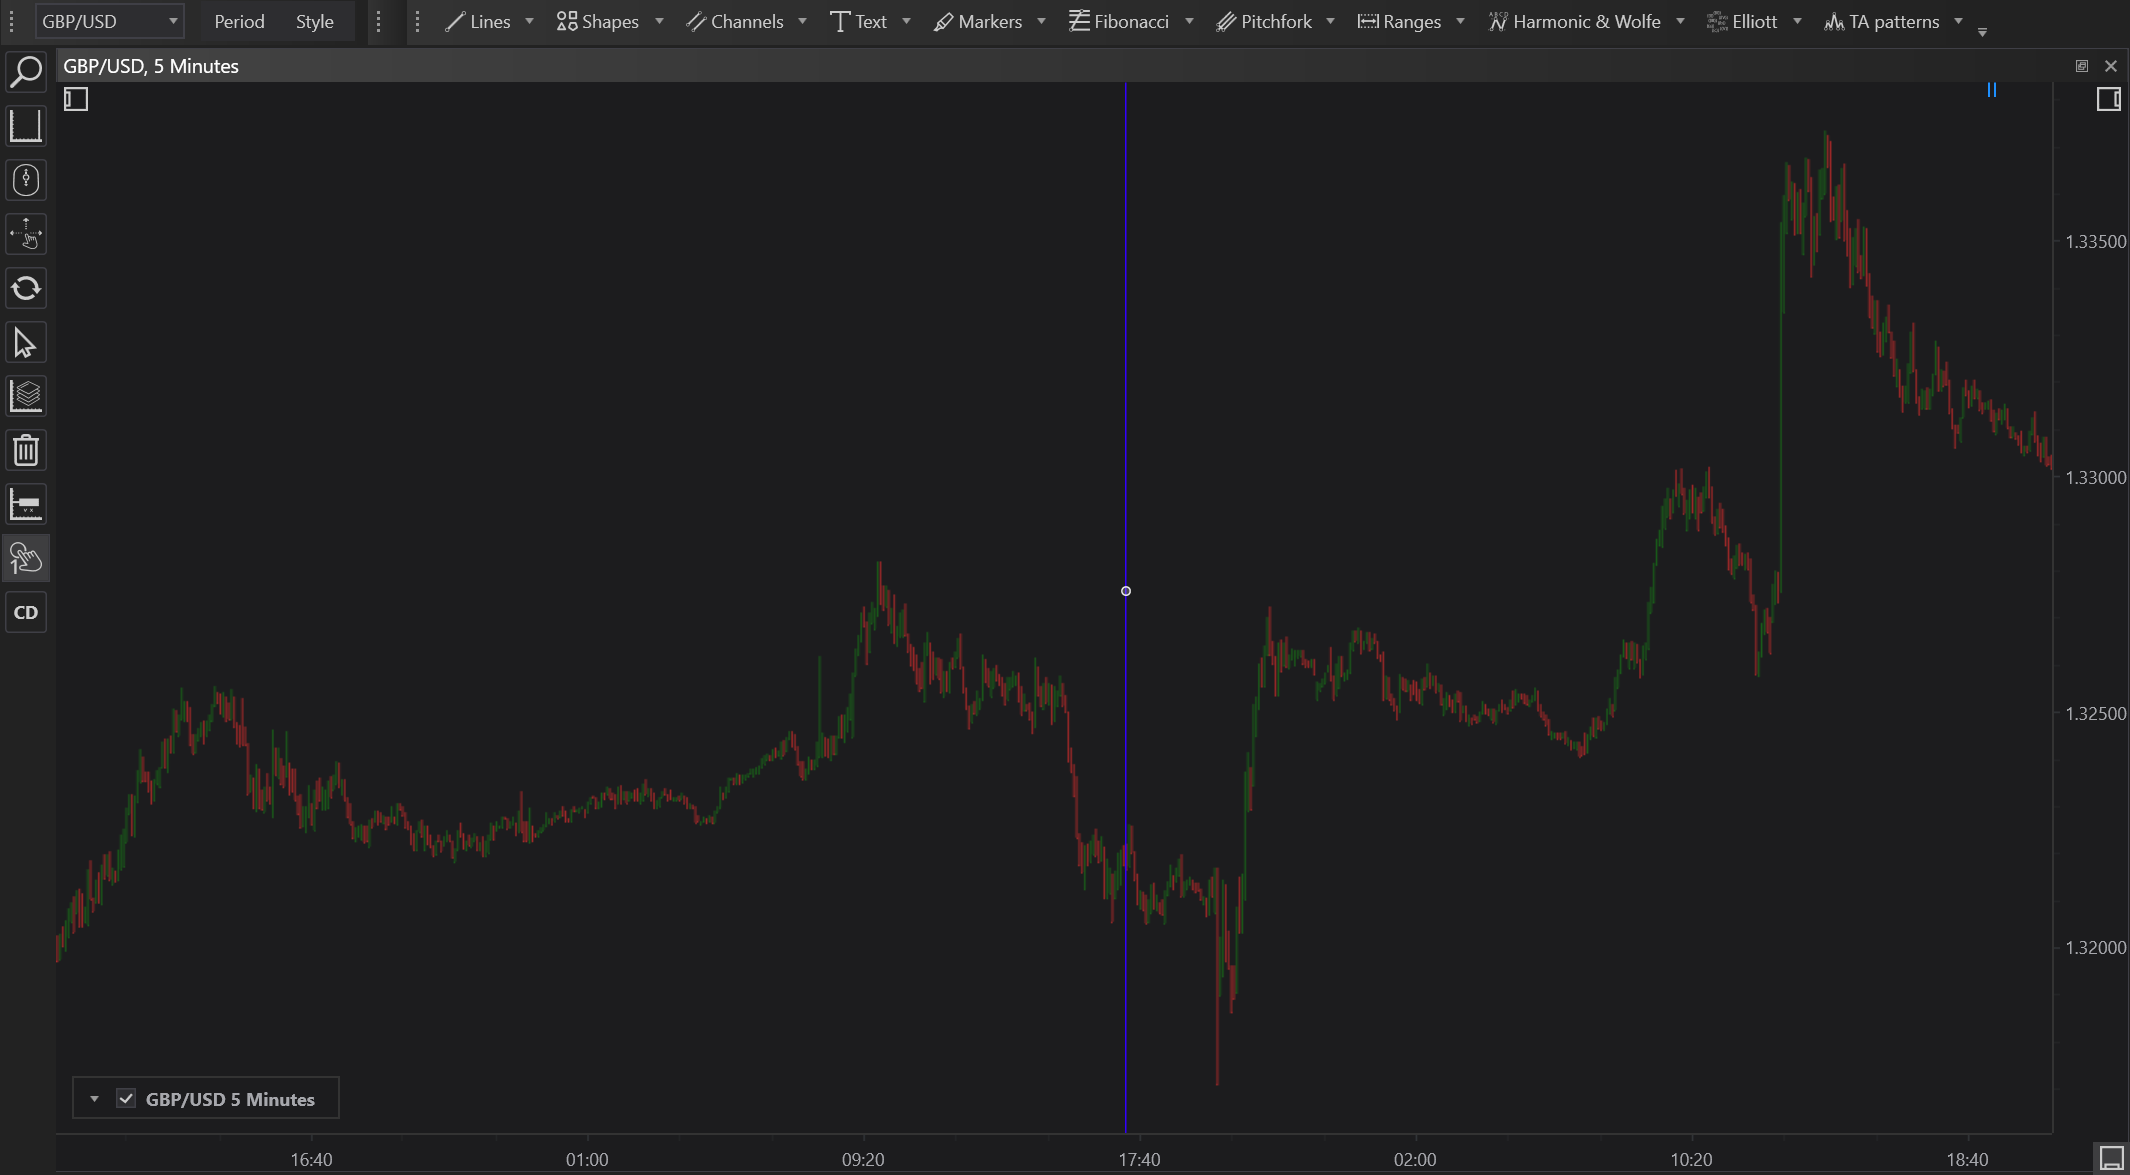
A Vertical Line is drawn perpendicularly to the time axis of a chart. It serves as a reference point for traders to denote specific moments in time, such as the release of economic reports, earnings announcements, or other market-moving events.
Applications
- Event Marking: Traders can place vertical lines on charts to mark the occurrence of fundamental events, helping correlate the impact of these events on market prices.
- Period Division: Vertical lines are useful in segmenting charts into specific trading sessions or periods, making it easier to analyze periodic performance or patterns.
- Comparison: By marking the same time across multiple charts, traders can compare how different instruments react simultaneously to market conditions.
Setting Up
To place a Vertical Line on a chart:
- Select the Vertical Line tool from the charting toolbar.
- Click on the desired location on the time axis where you want to place the line.
- The line will extend vertically across the entire chart, intersecting price data at the chosen time point.
Customization
Vertical Lines can be customized for color, style, and width, allowing them to be distinct or blend with the chart background depending on their intended use. Labels or annotations can also be added to provide additional context.
Conclusion
While simple, the Vertical Line is a powerful tool for marking time and events on price charts, providing clarity and context to technical analysis. Its use extends beyond mere annotation; it enhances the analytical capabilities of traders by providing clear demarcations of time-specific events and conditions. Whether used individually or as part of a comprehensive chart setup, the Vertical Line helps in creating a more structured and informative trading strategy.