Introduction
The Vertical Ray is a pivotal charting tool used by traders to mark significant moments in time while projecting into the future of a trading chart. Unlike a simple vertical line, which marks a specific point in time, a vertical ray extends indefinitely into the future, providing a continuous reference point.
Functionality
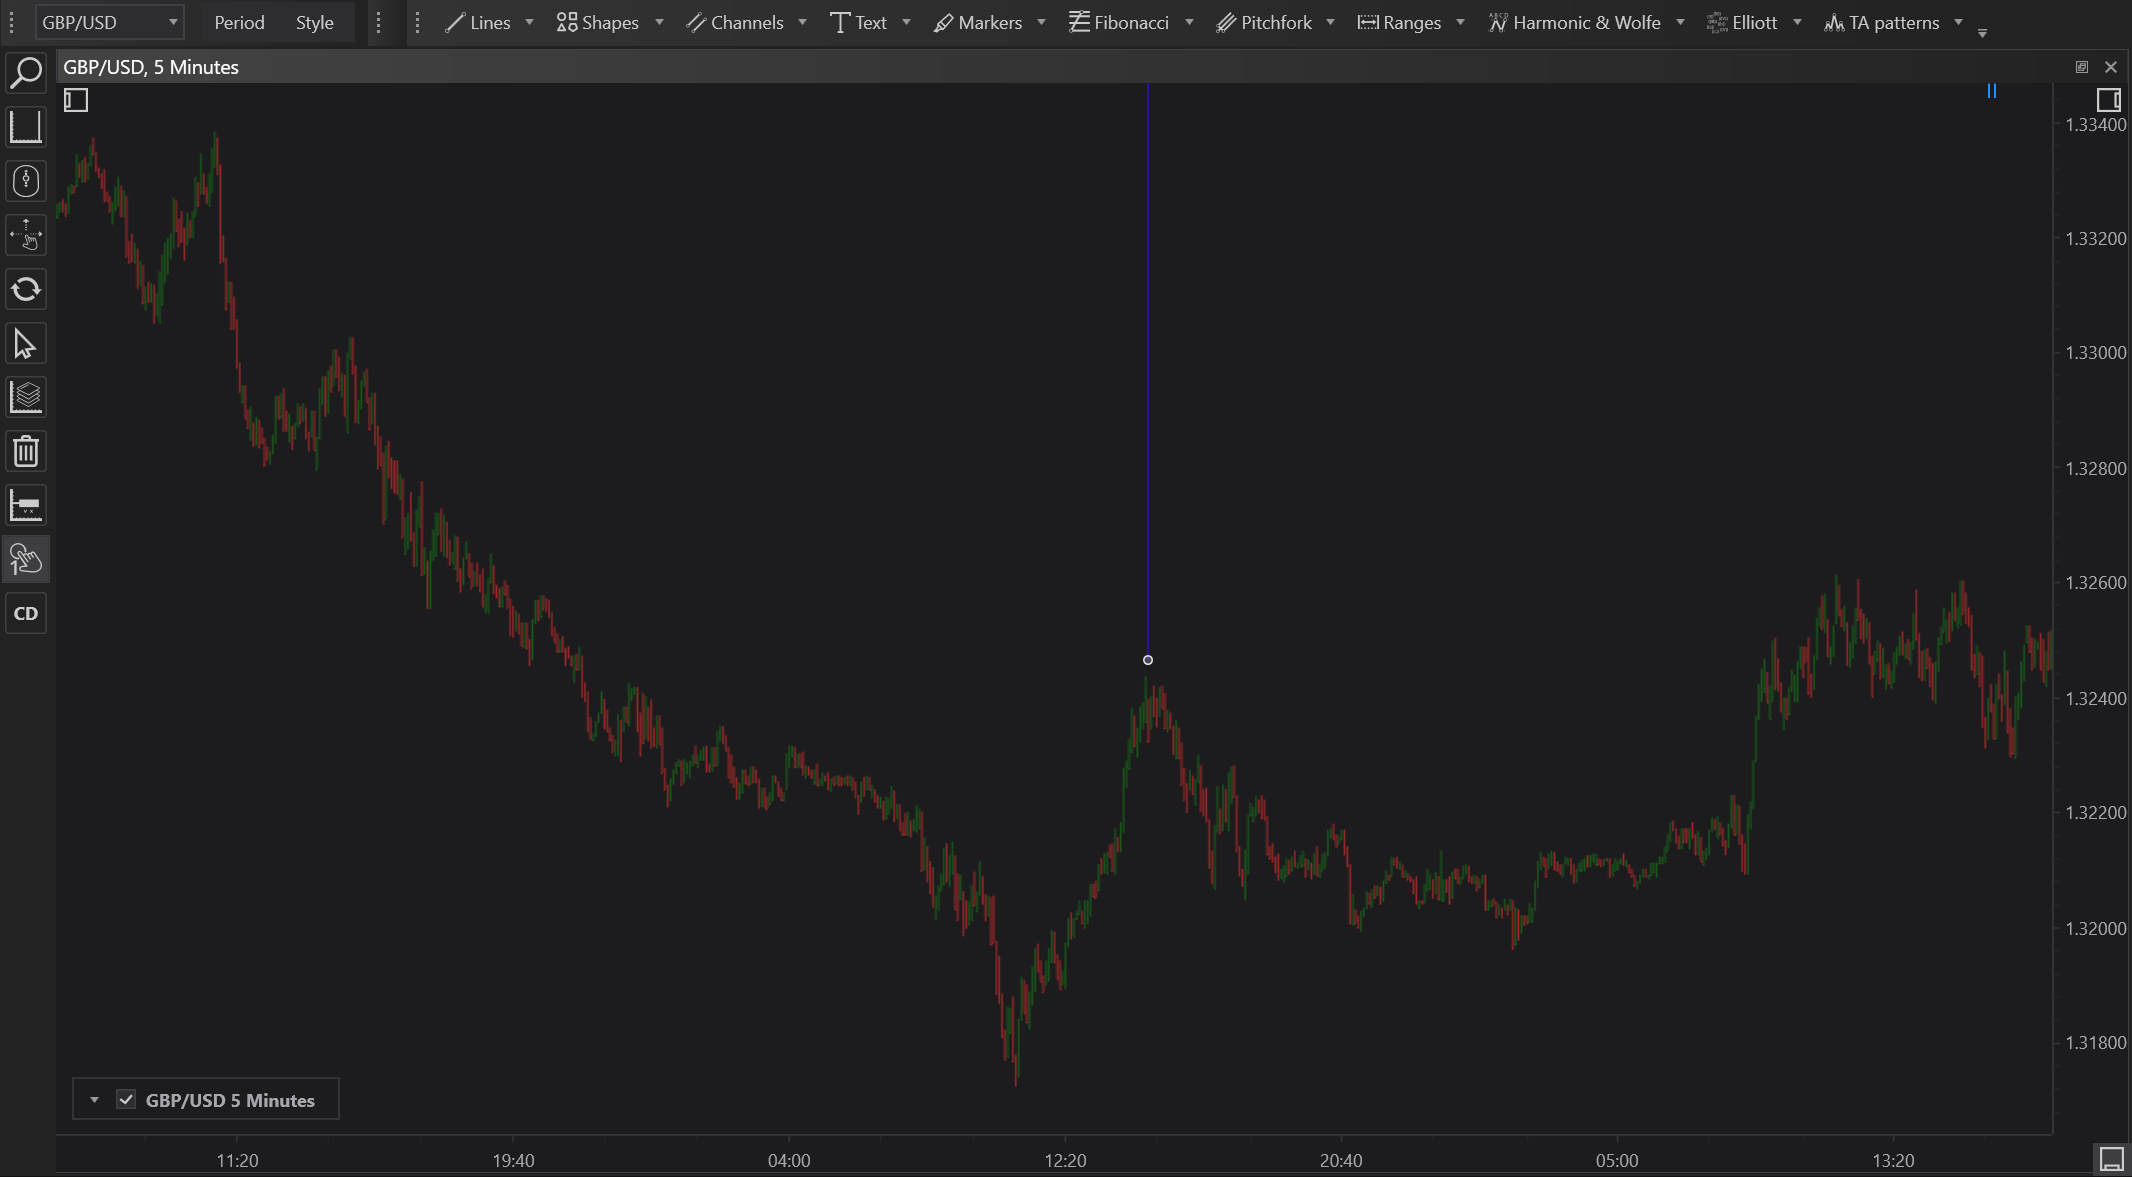
A Vertical Ray is anchored at a specific point on the time axis and extends vertically across the future axis of the chart. It helps traders in forecasting and planning for potential future events or expected market behaviors.
Applications
- Future Event Planning: Traders can use vertical rays to anticipate recurring events like earnings reports, option expirations, or economic data releases. The indefinite extension helps in visualizing the impact over future trading periods.
- Cycle Analysis: For markets with observable cycles, such as commodities or seasonal equities, vertical rays can mark the expected peak or trough periods in future cycles.
- Strategy Development: Traders can align their entry or exit strategies based on the projections offered by the vertical ray, planning long-term investments or trades.
Setting Up
To add a Vertical Ray to a chart:
- Select the Vertical Ray tool from the charting toolbar.
- Click on the chart at the point in time you wish to anchor the ray.
- The ray will appear, extending vertically from the selected point into the future of the chart.
Customization
Vertical Rays can be customized in terms of color, style, and opacity to differentiate them from other markings on the chart. Traders often use distinct colors to represent different types of events or to highlight their importance.
Conclusion
The Vertical Ray is an essential tool for traders who focus on long-term planning and strategy development. Its ability to extend into the future of a chart makes it uniquely valuable for anticipating events and aligning them with trading strategies. By effectively using Vertical Rays, traders can enhance their ability to forecast and react to market dynamics that extend well beyond the present moment.