Overview
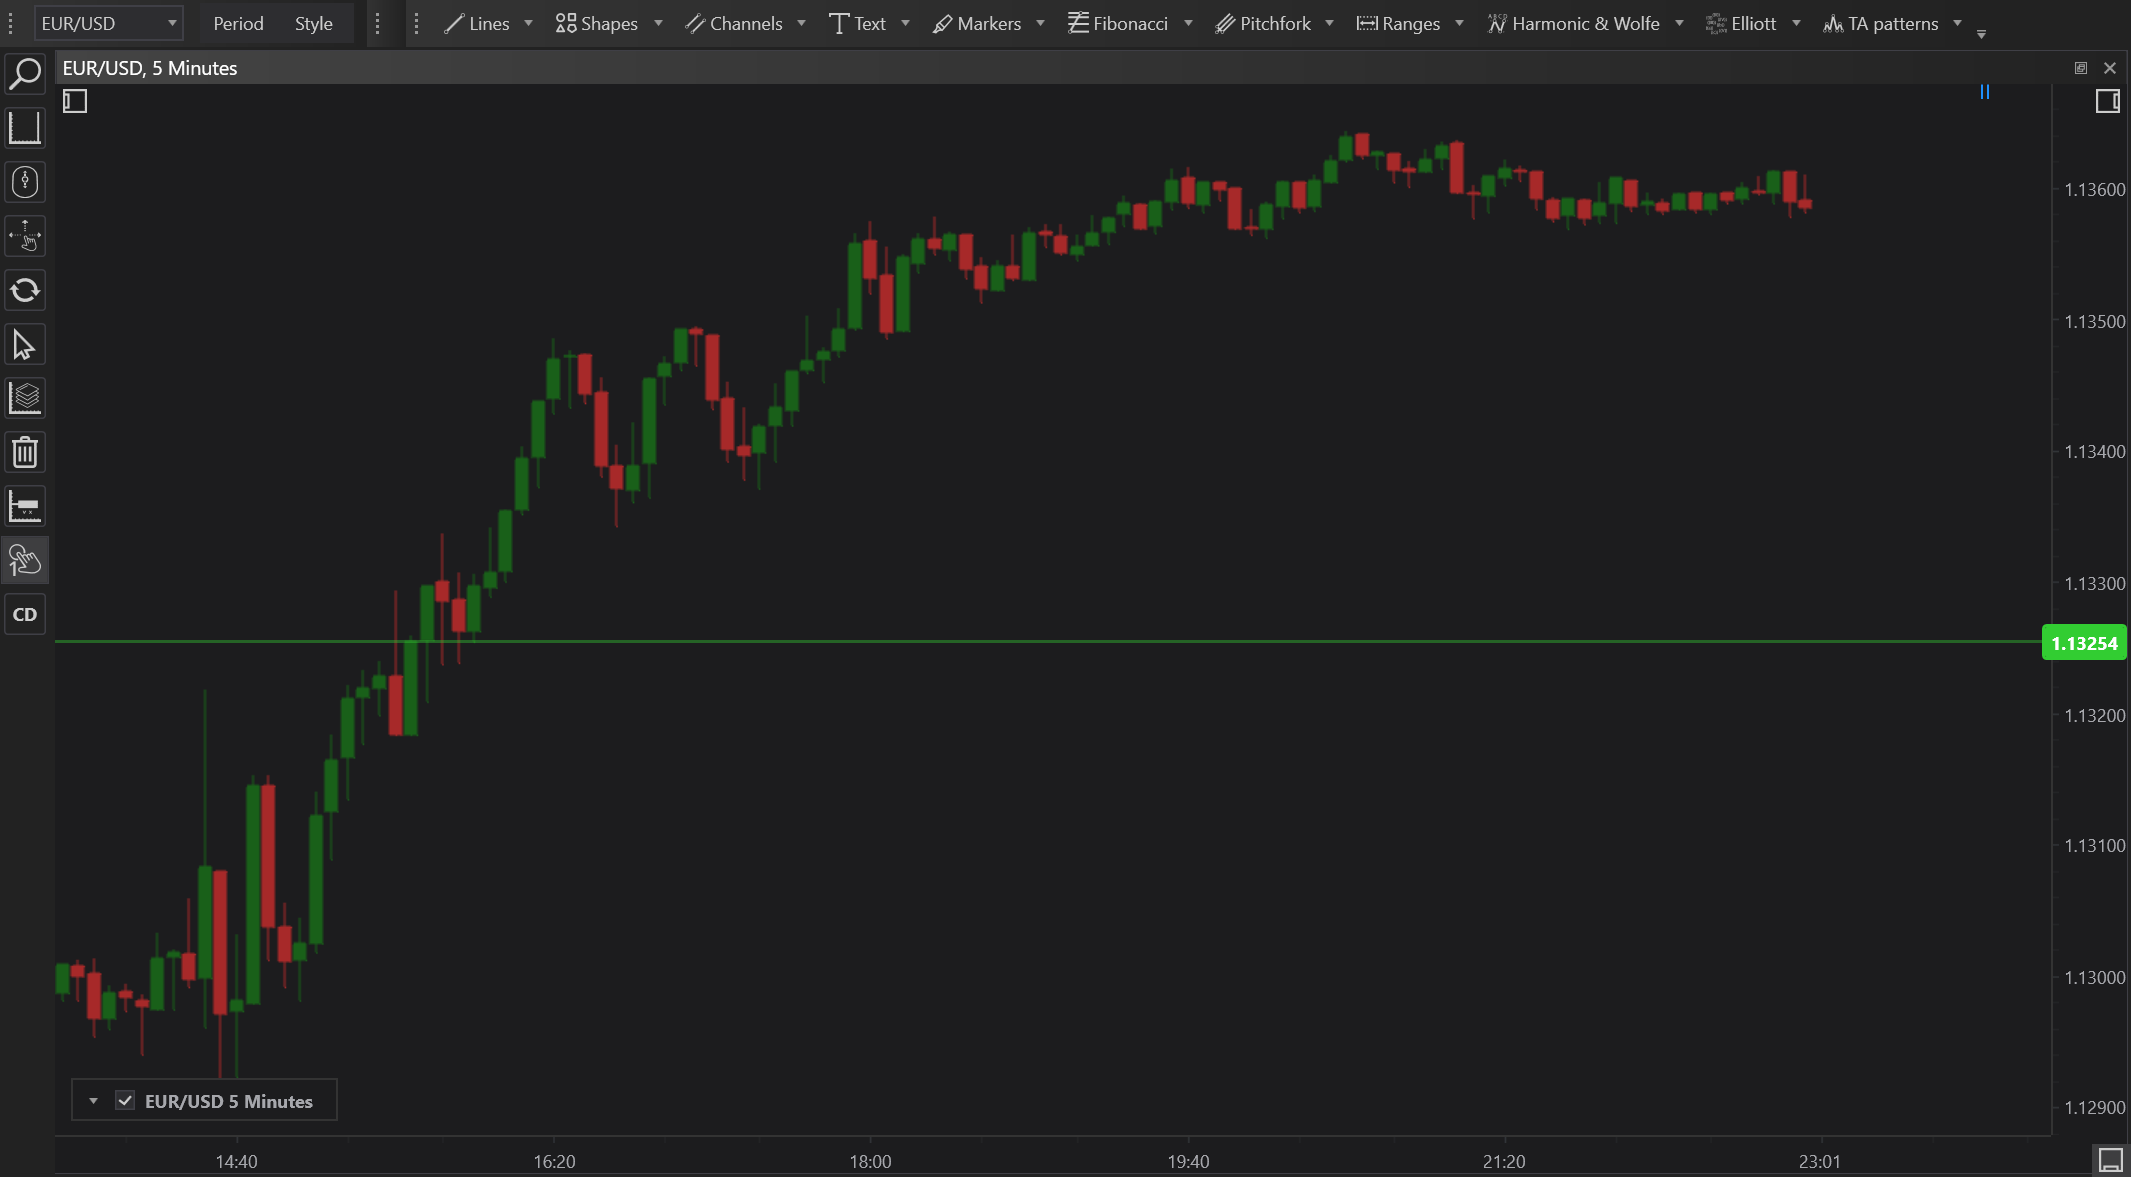
The Price Line Marker in FinStudio is an effective tool designed to track and display specific price levels across a chart. This tool is particularly useful for maintaining a clear view of target prices or key levels during trading sessions. It extends a horizontal line across the chart, providing a constant visual reference with an annotated price tag on the vertical axis.
Construction and Use
- Select the Tool: The Price Line Marker is available from the drawing tools menu in FinStudio.
- Placement on Chart: Click at the desired price level on the chart to place the Price Line Marker. It automatically extends across the entire width of the chart.
- Adjustment: The marker can be moved up or down to adjust to new price levels as analysis requirements change.
Features
- Visibility Across the Chart: The horizontal line stretches fully across the chart, ensuring the marked price level is visible regardless of scrolling or zooming.
- Customizable Appearance: Traders can customize the color and style of the line and the price tag, allowing for easy differentiation from other chart elements.
- Price Tag: On the right side of the chart, the Price Line Marker displays a price tag, which is colored differently to stand out and provide quick price level recognition.
Practical Applications
- Support and Resistance Identification: Useful for marking and observing key support and resistance levels over time.
- Trade Management: Allows traders to set visual reminders for entry and exit points, stop-loss levels, and take-profit levels.
- Comparative Analysis: By placing multiple Price Line Markers, traders can compare historical price levels and their impacts on current market behavior.
Benefits
- Enhanced Chart Analysis: Provides a clear and constant reference to specific price levels, enhancing the ability to make informed trading decisions.
- Real-Time Updates: As the market moves, the Price Line Marker remains static at the designated price level, offering real-time insight into market proximity to critical price points.
- Ease of Use: The tool’s simple functionality makes it accessible for traders of all experience levels, contributing to a streamlined analytical process.
Conclusion
The Price Line Marker is an indispensable tool in FinStudio, tailored for traders who require persistent visibility of crucial price levels on their charts. Its integration into the trading platform enhances chart analysis, aiding traders in maintaining focus on strategic price points and facilitating effective trade management. This tool is a staple for those who appreciate a clear and organized approach to technical charting.