Overview
The Date & Price Range tool in FinStudio is a versatile instrument designed to measure both the time span and the price movement between two points on a trading chart. This dual functionality makes it an indispensable tool for traders who need to assess the extent of a price change over a specific period.
Construction and Use
- Selecting the Tool: Access the Date & Price Range tool from the drawing tools menu on the FinStudio platform.
- Initial Placement: Click on the chart where you want to begin the measurement (usually at a significant high, low, or turning point in price action).
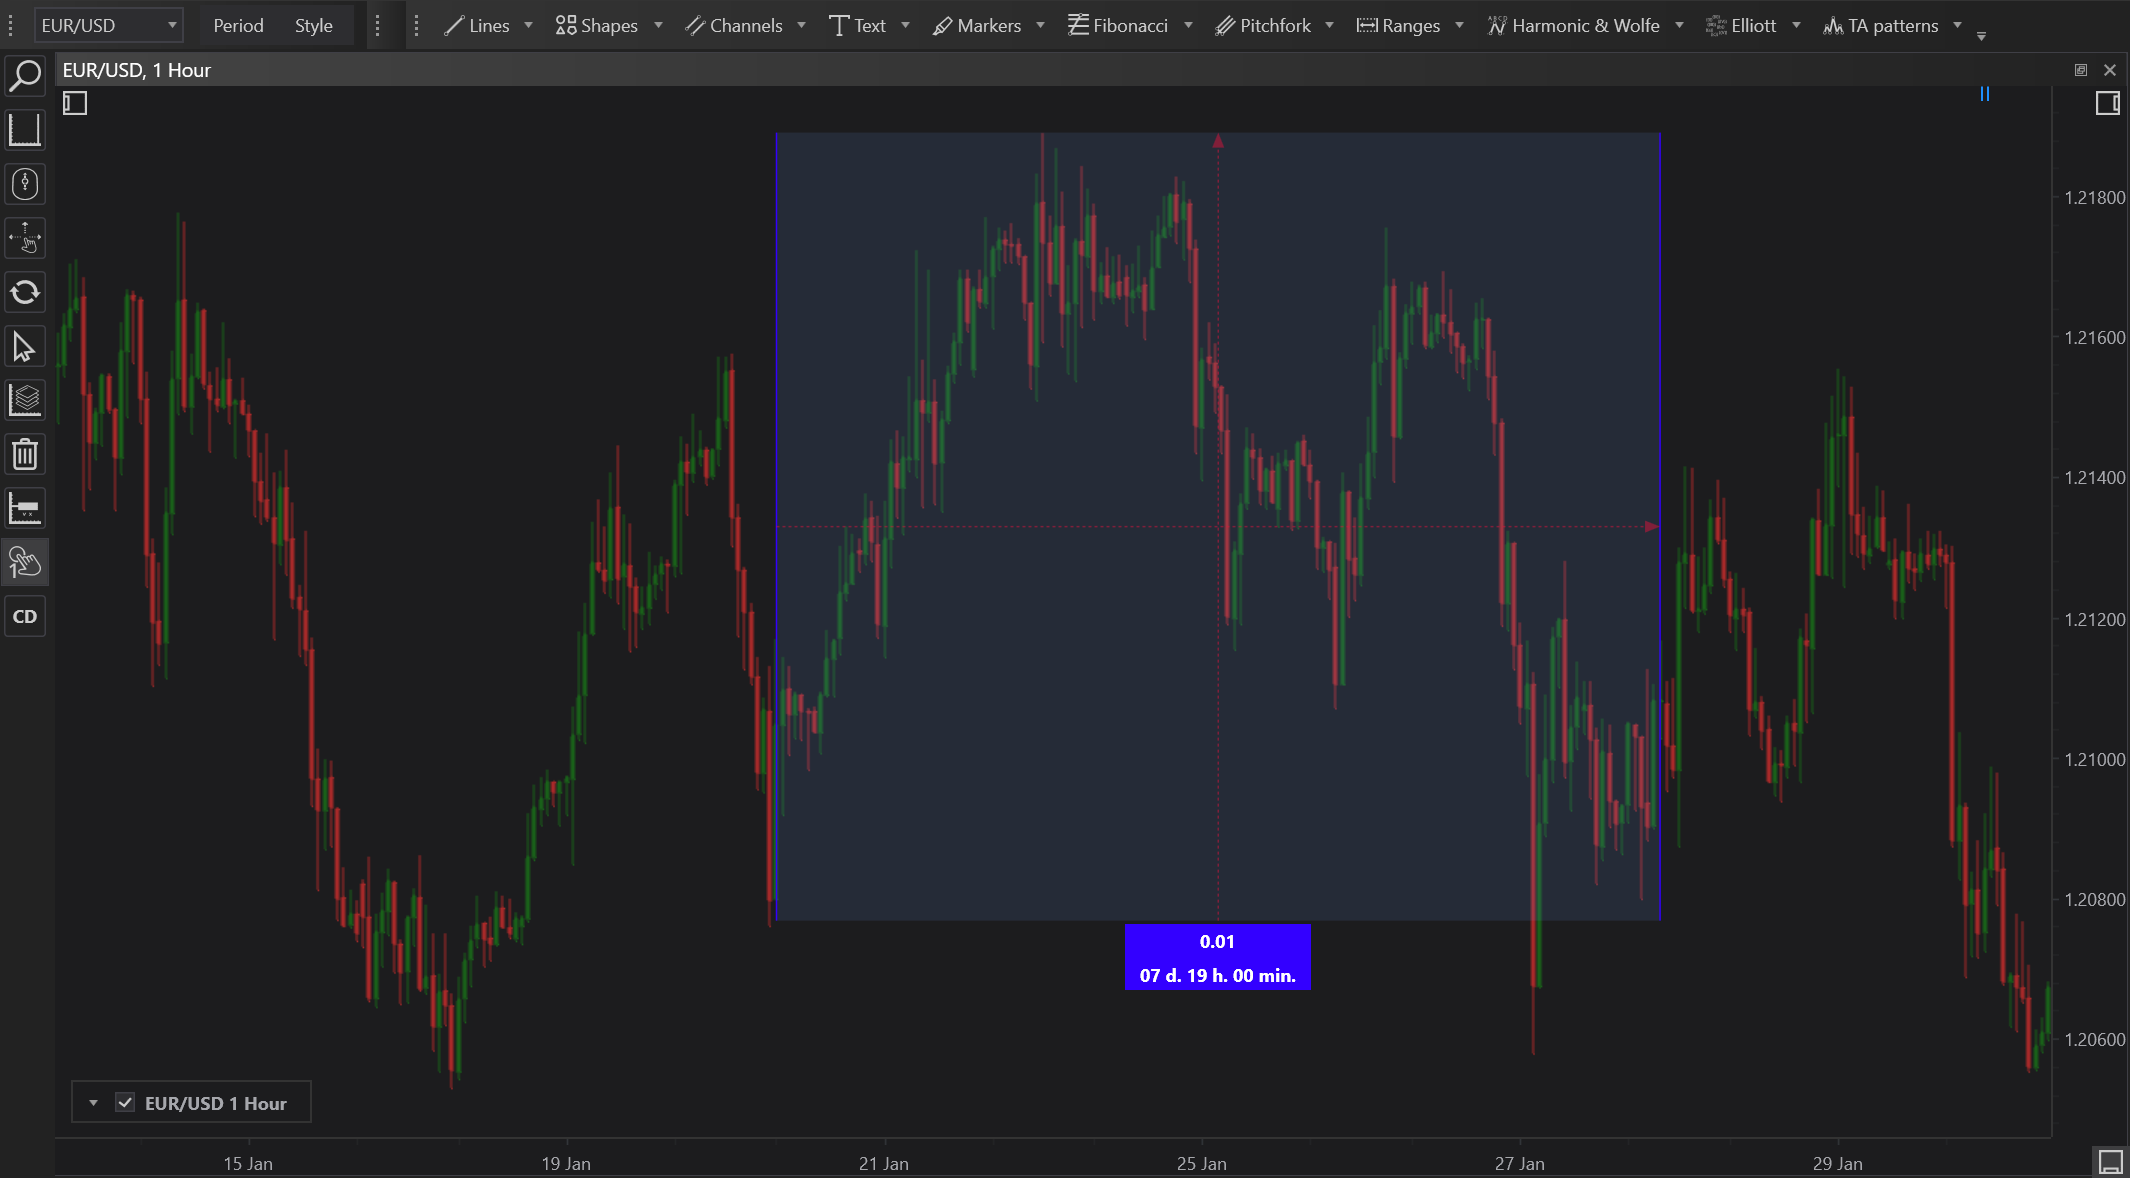
- Extending the Tool: Drag the tool to another significant point on the chart to mark the end of the range. This will automatically display both the time interval and the price difference between the start and end points.
- Adjustment: You can adjust the start and end points of the range as new data becomes available or as you refine your analysis. The tool updates the measurements in real-time to reflect any changes.
Features
- Dual Measurement: Simultaneously displays the number of time units (days, hours, minutes) and the price difference (in points or currency units) between two selected points.
- Customization Options: Users can customize the appearance of the Date & Price Range tool, including color, line style, and visibility, to suit their charting preferences and to distinguish it from other annotations.
- Interactive Guidelines: Provides visual feedback and numerical data as you adjust the range, ensuring accurate placement and measurement.
Practical Applications
- Performance Analysis: Traders can use the Date & Price Range tool to quantify how much a stock, commodity, or other asset has moved during a particular news event, earnings announcement, or other market catalysts.
- Historical Comparisons: It is useful for comparing the duration and intensity of past price movements to current events, helping to identify patterns or anomalies in market behavior.
- Strategic Planning: By measuring price movements over designated periods, traders can better plan entry and exit points, set stop-loss orders, and determine potential profit targets based on historical volatility and price behavior.
Benefits
- Enhanced Market Insight: Provides a clear, quantitative understanding of market dynamics over time, enhancing decision-making processes.
- Improved Risk Management: Helps in setting more precise risk parameters by providing exact figures for price changes and time durations.
- Efficiency: Saves time and increases accuracy in technical analysis by automating the measurement of critical market parameters.
Conclusion
The Date & Price Range tool in FinStudio is a powerful feature for traders who require precise, quantitative insights into market movements. Its ability to measure both time and price intervals on a single chart enhances its utility, making it a valuable addition to the trader's toolkit for effective market analysis and strategy development.