Overview
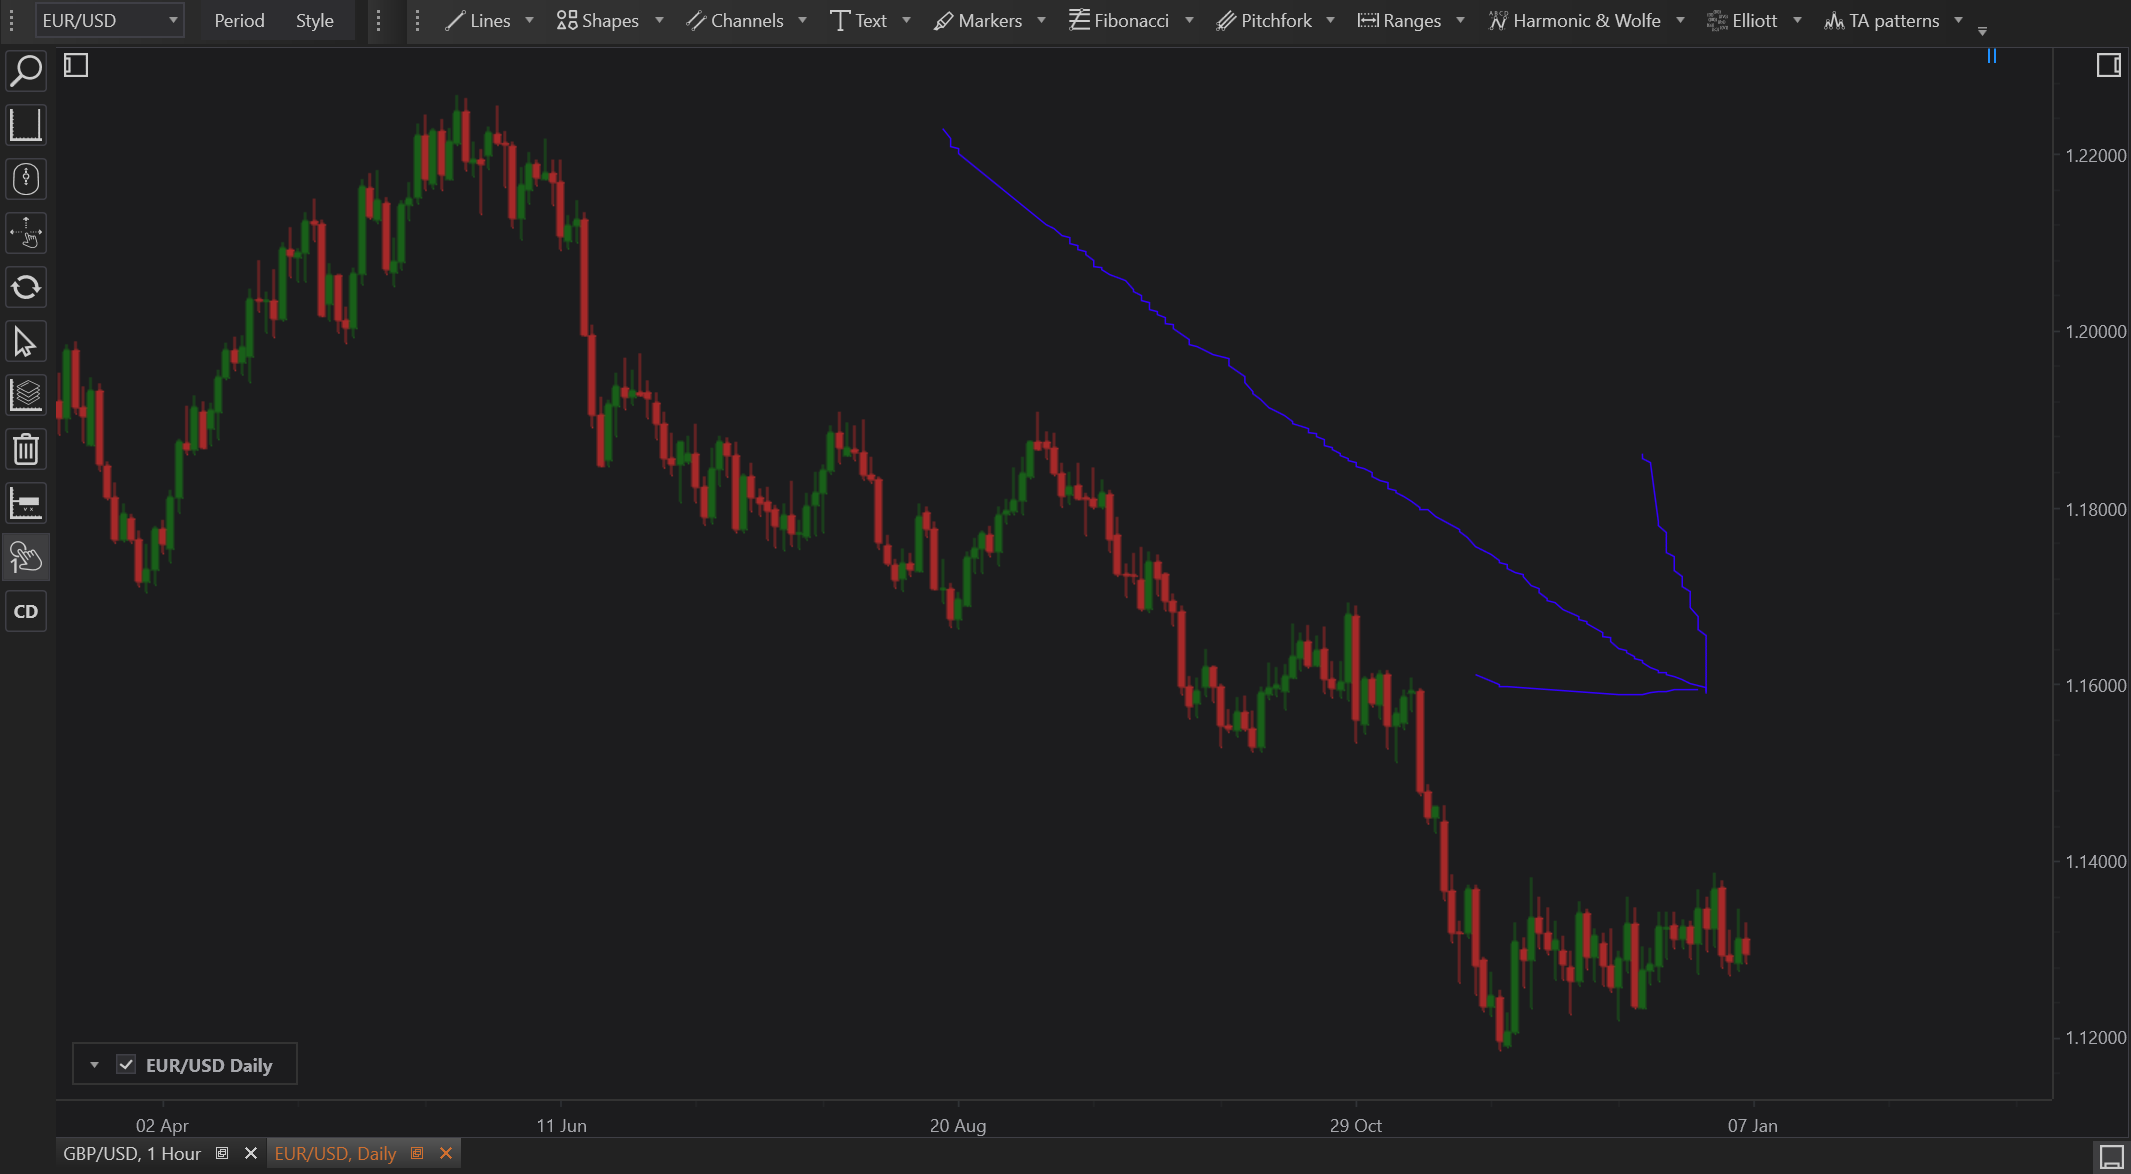
The Brush tool is an invaluable asset for traders and analysts who wish to add a personal touch to their chart analysis. This freeform drawing tool allows users to highlight, underline, or annotate parts of the chart in a more informal and illustrative way than structured drawing tools.
Functionality of the Brush Tool
- Highlighting Features: The Brush can be used to highlight areas of interest on the chart, such as significant price movements, patterns, or anomalies.
- Underlining Key Data: It can also be used to underline important prices or dates, drawing the viewer’s attention directly to these elements.
- Custom Annotations: Unlike predefined shapes or lines, the Brush allows for freeform drawing, giving the user the freedom to create custom annotations or artistic touches.
How to Use the Brush Tool
- Select the Brush Tool: From the charting platform's drawing tools menu, choose the Brush tool.
- Draw on the Chart: Click and hold the mouse button to start drawing on the chart. Move the mouse to create freeform lines or shapes.
- Customize Settings: Before drawing, customize the brush size, color, and opacity to fit the specific needs of your analysis. These options are usually found in the tool’s properties section.
Practical Examples
- Technical Pattern Emphasis: Use the Brush to circle or highlight technical patterns like head and shoulders, cup and handle, or triangles.
- Behavioral Annotations: Mark out price behavior during major economic announcements or market openings and closings.
Advantages
- Flexibility: Offers a level of flexibility not available with more structured tools, perfect for creative or less rigid analyses.
- Ease of Use: Simple to use, requiring no technical knowledge of charting patterns or indicators.
Limitations
- Professional Appearance: May not always convey a professional appearance; overuse can make charts look cluttered or less formal.
- Precision: Lacks the precision of other drawing tools like lines or arrows, which can be crucial for exact technical analysis.
Conclusion
The Brush tool is a dynamic addition to the technical analyst’s toolkit, perfect for informal annotations and creative chart markups. While it should be used judiciously to maintain the professionalism of presentations, it offers a unique way to engage with and interpret chart data visually.