Overview
The Ellipse tool in FinStudio is a versatile drawing tool used by traders and analysts to highlight specific areas on a chart that are significant for various analytical reasons. The ellipse can encircle zones of interest, such as potential support and resistance levels, pivot points, or significant price accumulations.
Functionality of the Ellipse Tool
- Concentration Zones: Ideal for marking areas where price action shows consolidation or congestion.
- Focus on Extremes: Useful for highlighting extreme high or low points that may signify turning points or areas of strong market reaction.
How to Use the Ellipse Tool
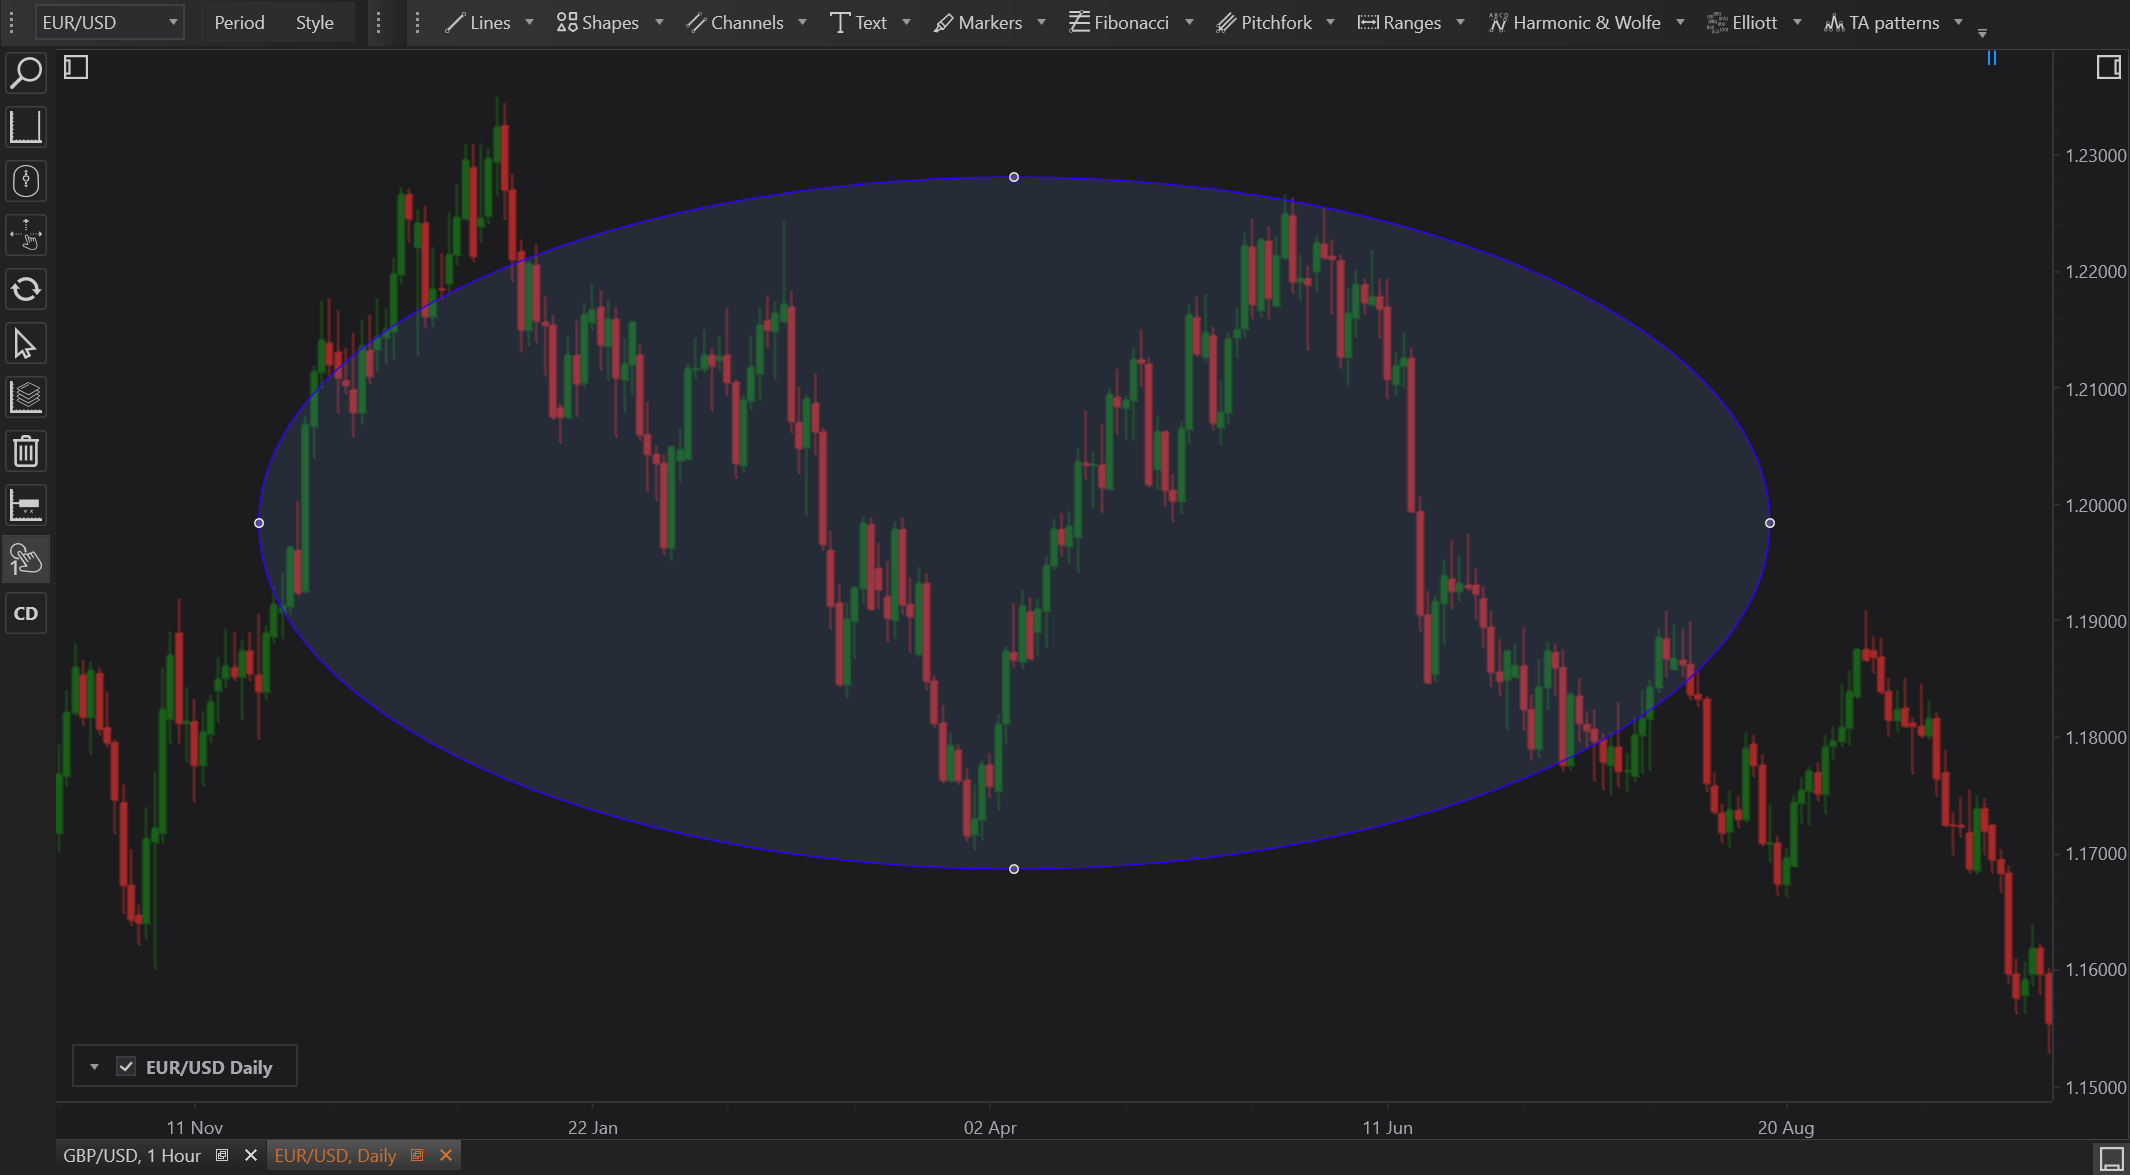
- Select the Ellipse Tool: Access this tool from the drawing tools toolbar within FinStudio.
- Place the Ellipse: Click and drag on the chart to draw the ellipse around the desired area. The initial click defines the starting corner of the bounding rectangle of the ellipse.
- Adjust Size and Shape: Modify the width and height by dragging the edges of the bounding box to cover the area of interest accurately.
- Customize Properties: Set specific attributes such as color, line style, and fill opacity to ensure the ellipse stands out or blends with the chart, as necessary for the analysis.
- Fine-tuning: Move or resize the ellipse as market data changes or as further analysis dictates adjustments.
Practical Examples
- Identifying Breakouts: Use an ellipse to mark a consolidation range before a breakout, helping to visualize where price might be compressing before making a significant move.
- Risk Management: Highlight risk zones where price action has shown historical reversals or increased volatility, aiding in setting stop-loss or take-profit levels.
Advantages
- Visual Clarity: Provides a clear and effective visual means to focus on specific areas without obscuring other important chart information.
- Dynamic Analysis: Can be easily adjusted as new data becomes available, making it a dynamic tool suitable for evolving market conditions.
Limitations
- Subjectivity: The placement of an ellipse can be highly subjective and may require adjustment as new market data influences analysis.
- Over-interpretation: Incorrect or overuse can clutter a chart, potentially leading to confusion or misinterpretation of market signals.
Conclusion
The Ellipse tool in FinStudio serves as a powerful graphical aid for highlighting areas of interest on a chart, providing traders and analysts with a method to visually mark significant zones. This tool enhances the analysis by allowing for quick identification of key areas that warrant attention, thereby supporting more informed decision-making in trading.