Overview
The Polygon tool in FinStudio is designed for technical analysts and traders who need to define and highlight complex areas on a chart. This tool is particularly useful for enclosing multiple price points or irregular zones that do not conform to standard geometric shapes.
Functionality of the Polygon Tool
- Versatile Marking: Allows for the creation of multi-sided shapes that can adapt to the contours of specific chart patterns or areas of interest.
- Custom Boundary Definition: Traders can delineate areas that include a combination of highs, lows, and other significant points in the market.
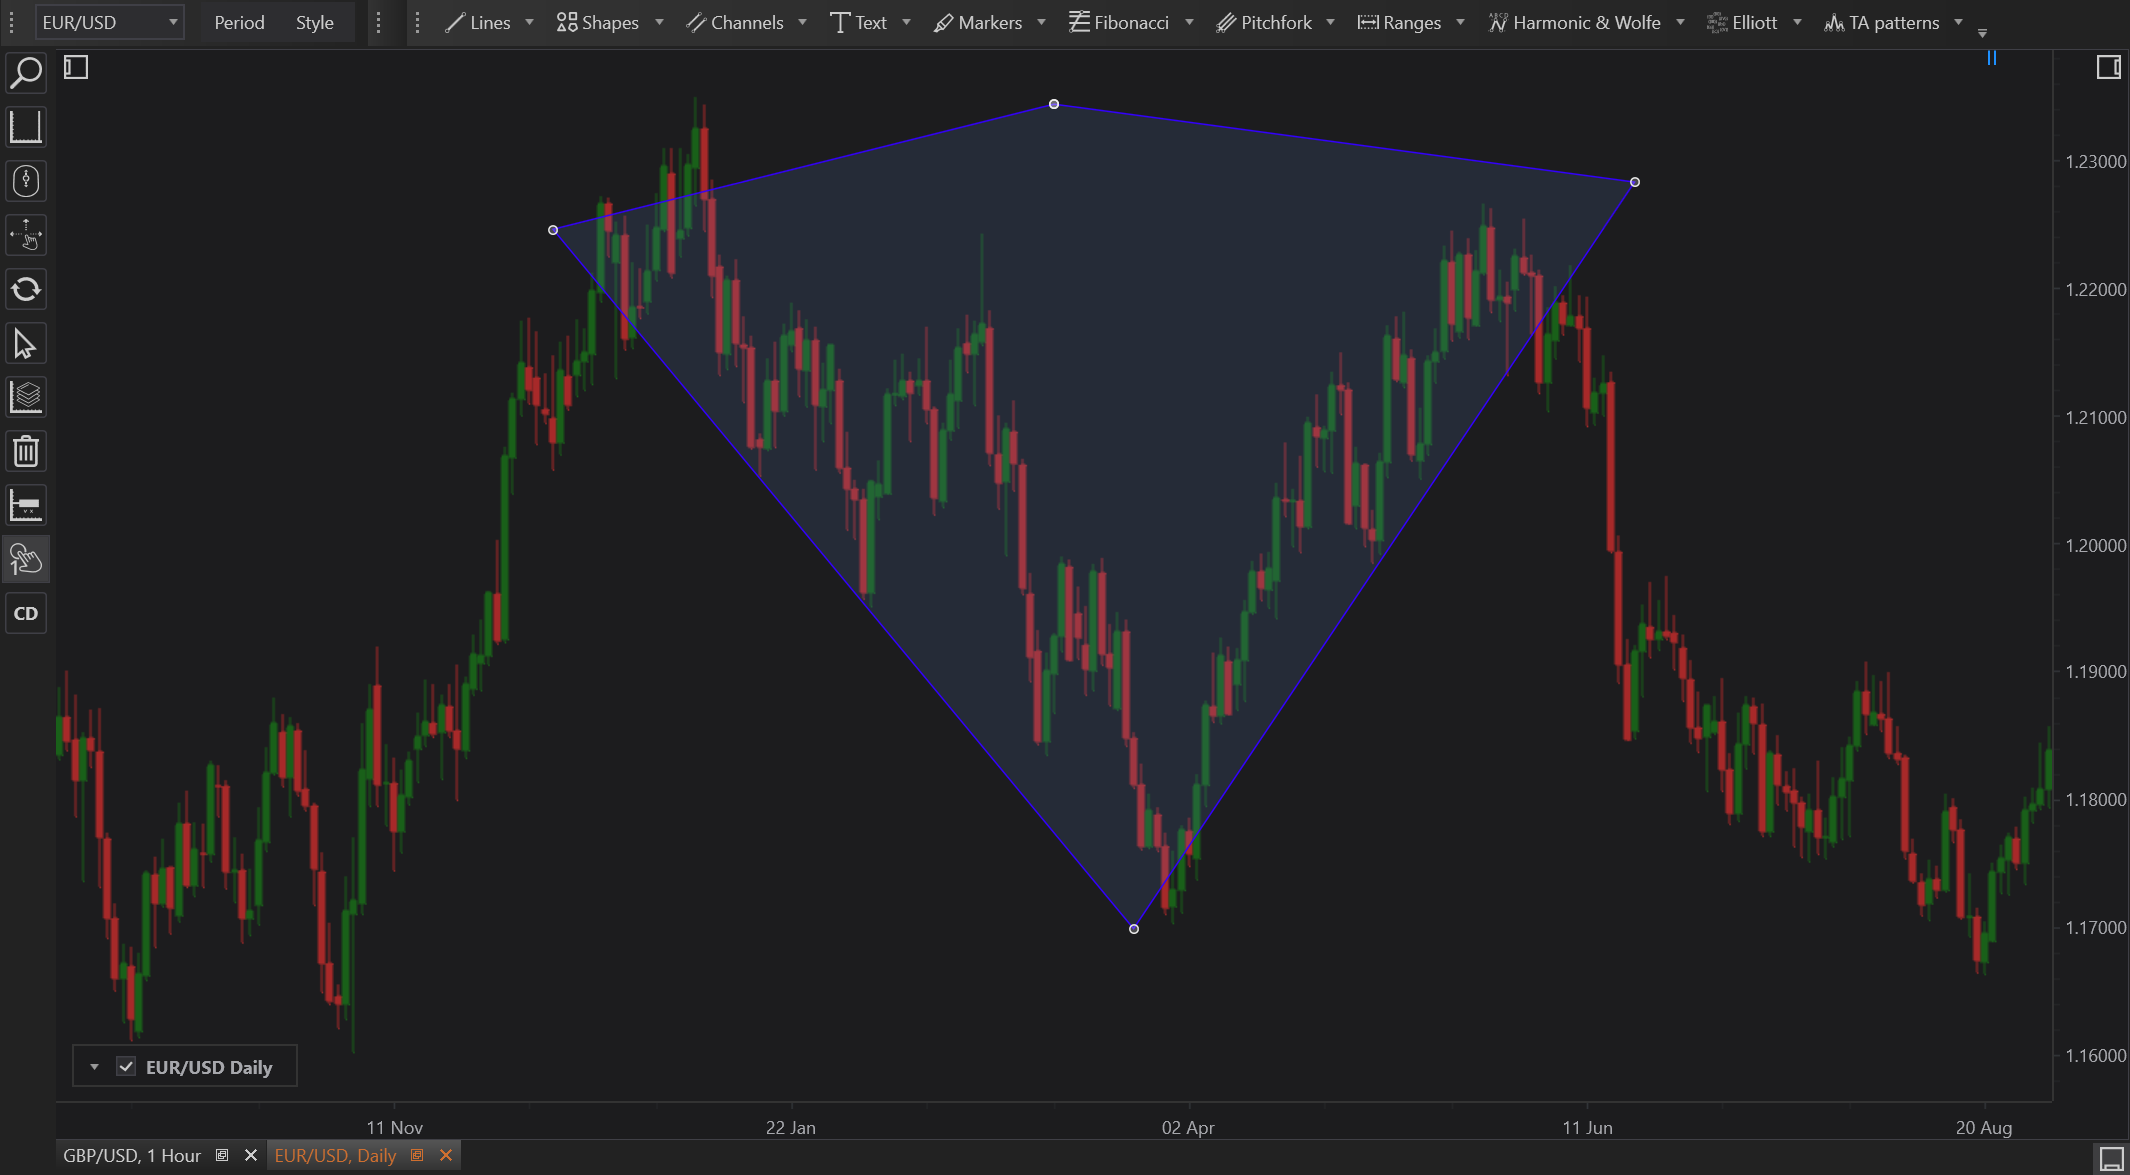
How to Use the Polygon Tool
- Select the Polygon Tool: This tool is available in the drawing tools toolbar within FinStudio.
- Draw the Shape: Click on the chart to set each vertex of the polygon. Each click sets a corner, and the lines will automatically connect these points.
- Complete the Shape: After placing the last point, either double-click or connect back to the first point to close the polygon.
- Adjust Properties: Customize the polygon by setting color, line thickness, and opacity to make the shape distinct and integrated into the overall chart analysis.
- Edit as Needed: Points can be moved after placement to refine the shape according to new data or further analysis insights.
Practical Examples
- Support and Resistance Zones: Use polygons to encircle areas where multiple support or resistance levels converge, providing a visual representation of significant barriers in price movements.
- Pattern Recognition: Draw around complex patterns like Gartley or Butterfly patterns where multiple pivot points need to be connected and observed.
Advantages
- Customizability: Offers high flexibility in drawing, allowing analysts to cover exactly the areas needed without restriction to predefined shapes.
- Clarity in Complexity: Helps in visualizing and analyzing complex patterns that are not easily identifiable with simpler drawing tools.
Limitations
- Complexity in Use: More complex to use than basic shapes, requiring more clicks and adjustments to accurately represent desired areas.
- Potential Clutter: Can lead to cluttered charts if overused or if too many polygons overlap, which might obscure other important chart details.
Conclusion
The Polygon tool in FinStudio is an essential feature for those requiring detailed and specific delineation of areas on a chart. It supports advanced technical analysis by allowing the user to highlight intricate or composite patterns and zones with precision, aiding in a deeper understanding and interpretation of market dynamics. This tool enhances analytical capabilities by providing the flexibility to visually capture and consider complex price behaviors within the trading environment.