Overview
The Rectangle tool in FinStudio is a fundamental drawing tool used by traders and analysts to mark specific ranges of price action or to highlight areas of interest on a chart. This tool is effective for visually representing consolidation zones, potential breakout regions, and other significant price levels.
Functionality of the Rectangle Tool
- Range Highlighting: Perfect for emphasizing price consolidation zones where the market moves sideways between two price levels.
- Breakout Identification: Useful for marking areas where a breakout is anticipated, providing a clear visual cue for entry or exit points.
How to Use the Rectangle Tool
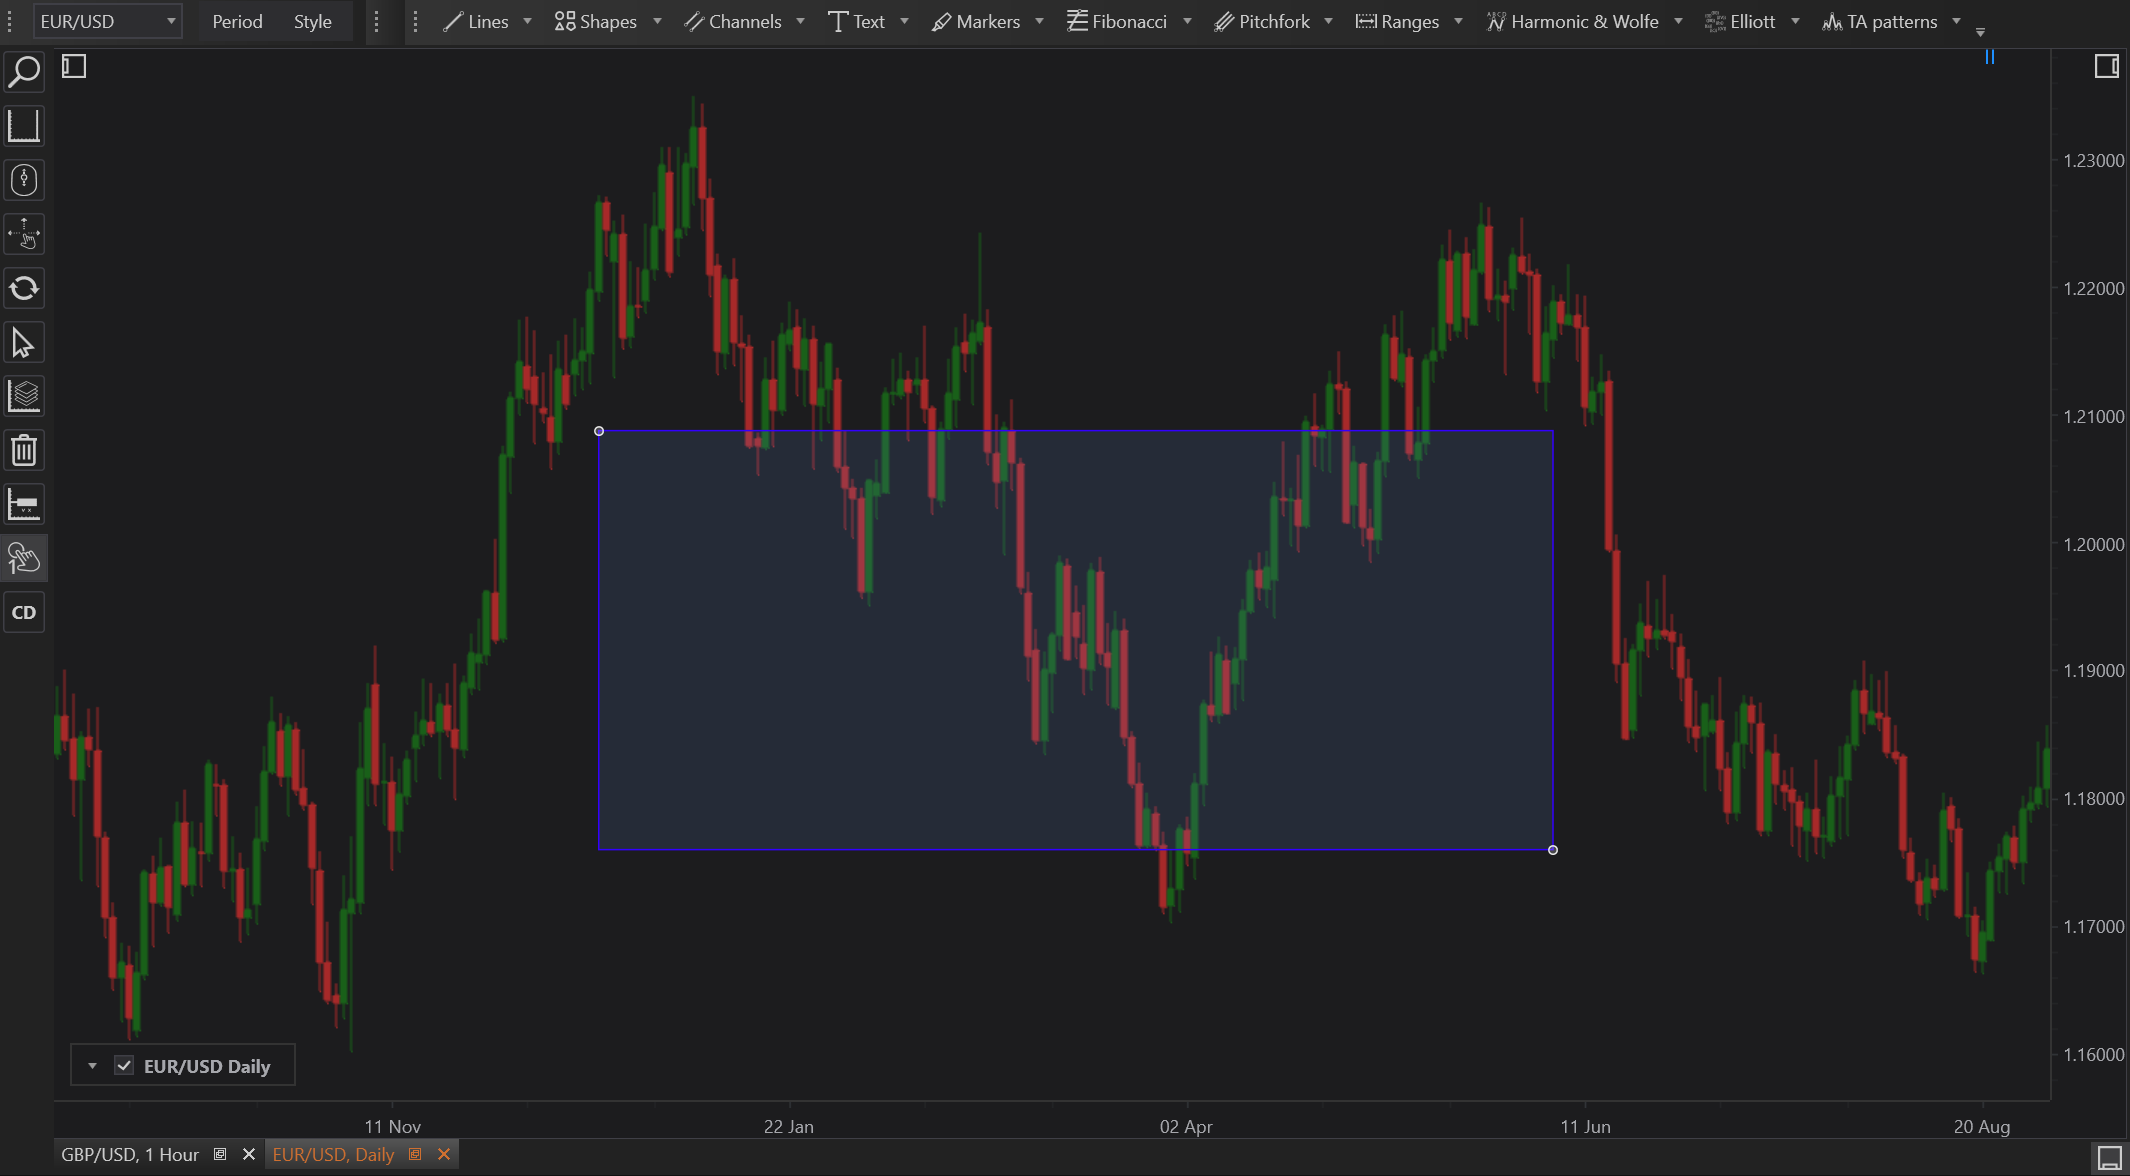
- Select the Rectangle Tool: Find this tool on the drawing tools toolbar in FinStudio.
- Draw the Shape: Click and drag on the chart to create the rectangle. The initial click defines one corner of the rectangle, and dragging extends it to the desired size and shape.
- Adjust Properties: Once drawn, customize the rectangle’s color, border, and fill opacity through the Properties section to enhance visibility and integration into the chart setup.
- Refine Positioning: The corners of the rectangle can be adjusted after placement to fine-tune its position and dimensions as market conditions change or more information becomes available.
Practical Examples
- Support and Resistance: Rectangles can be drawn to cover ranges of tight price action, helping to identify key levels of support and resistance within larger trends.
- Pattern Trading: Useful in pattern trading strategies, such as trading breakouts from rectangles which often signify periods of consolidation followed by a significant price move.
Advantages
- Visual Simplicity: Provides a clear and straightforward visual representation of specified areas without any clutter, making it easy to identify and react to.
- Strategic Planning: Enhances strategic trade planning by clearly delineating areas where specific actions should be taken, such as setting stop-loss orders or preparing for potential breakouts.
Limitations
- Over-Simplification: While rectangles simplify the visualization of data, they may overlook finer details of price action within the boxed area, potentially leading to oversights in volatile markets.
- Static Nature: Once drawn, rectangles do not adjust automatically to changing market conditions and need manual adjustment to remain relevant.
Conclusion
The Rectangle tool in FinStudio is invaluable for traders who need to define clear boundaries within which significant price action has occurred or is expected to occur. Whether used for marking consolidation zones, potential breakout regions, or for general emphasis on specific chart areas, the Rectangle tool aids in the clear visualization and strategic analysis of price movements. Its ease of use and customization options make it a versatile addition to the trader's toolkit, promoting better decision-making through enhanced chart clarity.