Overview
The Rotated Rectangle tool in FinStudio provides a dynamic means to annotate and analyze chart data, especially when aligning with trend lines or diagonal support and resistance areas that do not conform to horizontal or vertical constraints. This tool allows for more nuanced and precise marking of chart areas, crucial for technical analysis in varied market conditions.
Functionality of the Rotated Rectangle Tool
- Diagonal Highlighting: Ideal for encapsulating price patterns that follow a tilted angle, such as ascending or descending channels.
- Flexible Orientation: Can be rotated to any angle, providing versatility in marking zones that are aligned with trend lines or the directional movement of prices.
How to Use the Rotated Rectangle Tool
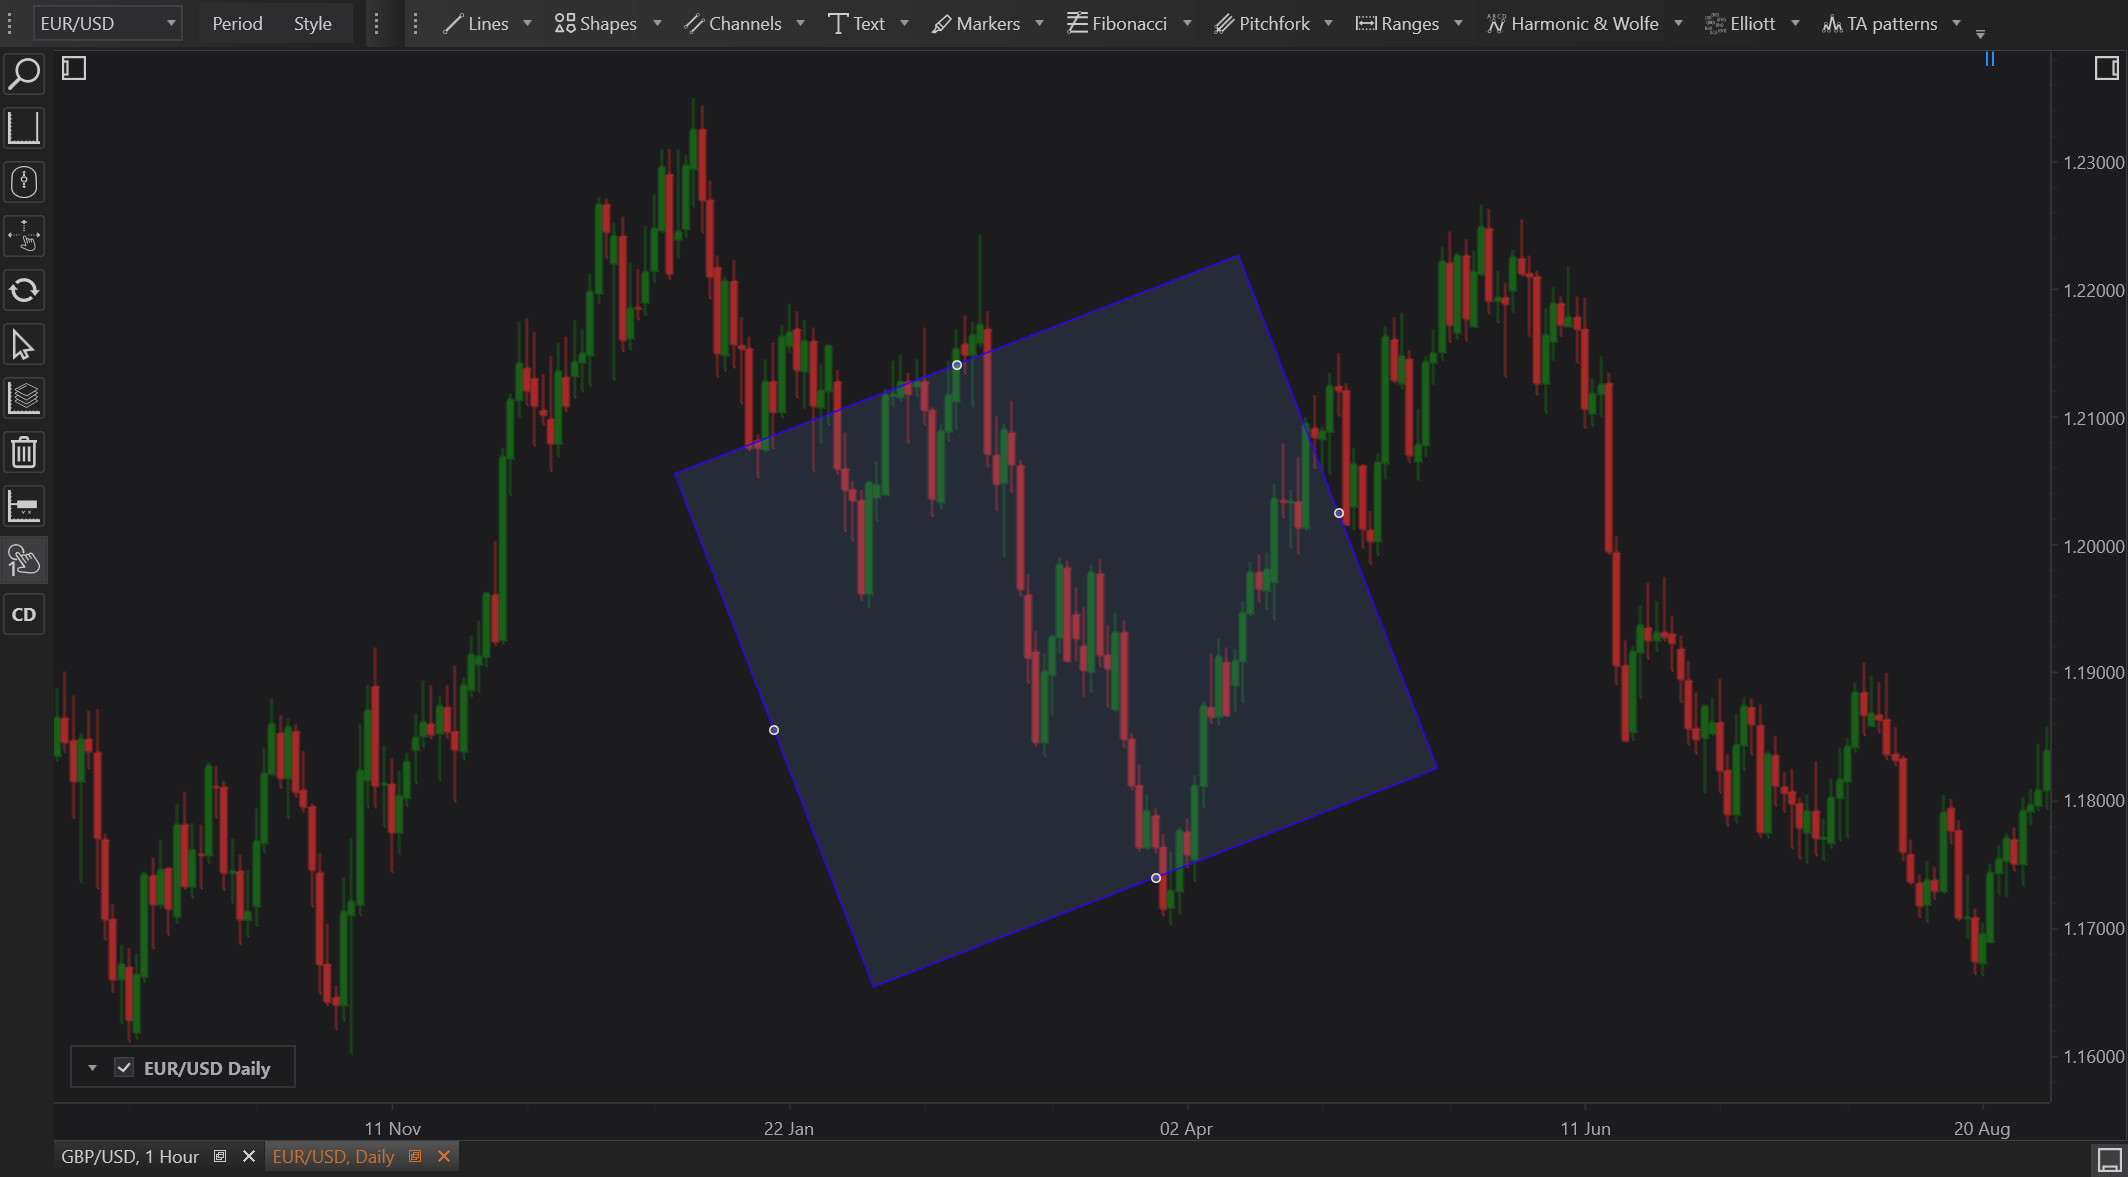
- Access the Tool: Select the Rotated Rectangle tool from the FinStudio drawing tools toolbar.
- Drawing the Rectangle: Click and drag on the chart to draw the rectangle. Release the mouse at the initial angle desired.
- Adjusting the Orientation: Post-drawing, hover near the corners or edges to see rotation handles that allow for tilting the rectangle to the desired angle.
- Customizing Properties: Modify the rectangle’s appearance through the Properties panel, adjusting aspects like color, line style, and opacity to match analysis needs.
Practical Examples
- Aligning with Trend Lines: Useful for creating visual references that align with non-horizontal trend lines, aiding in the identification of potential entry and exit points along trends.
- Pattern Analysis: Enhances the visibility of price patterns like flags or pennants that might tilt as they develop.
Advantages
- Versatility in Analysis: Allows for an accurate representation of price areas that follow a trend at an angle, providing a better fit than standard horizontal or vertical rectangles.
- Enhanced Visual Clarity: By aligning with the natural flow of price action, it improves the clarity and relevance of chart markings, making it easier to interpret complex patterns.
Limitations
- Complexity in Adjustment: While it offers greater flexibility, it might require more time to adjust and align perfectly with price data, potentially complicating quick analysis during fast-moving market scenarios.
- Risk of Subjectivity: The angle of the rectangle might introduce a level of subjectivity in its placement, which could lead to different interpretations among analysts or traders.
Conclusion
The Rotated Rectangle tool in FinStudio is an essential asset for technical traders who need to adapt their chart markings to the dynamic nature of market price movements. By allowing for rotation and flexible adjustment, this tool caters to a sophisticated level of chart analysis, aligning perfectly with diagonal trends and patterns. Its use enhances the trader's ability to visually track and analyze patterns that deviate from standard horizontal or vertical orientations, making it a valuable tool for detailed technical analysis.