Functionality of the Triangle Tool
- Pattern Highlighting: Excellent for outlining convergence areas where the market might be gearing up for a significant move, either upward or downward.
- Visual Guidance: Aids in the visual representation of trend lines converging to form triangles, which are pivotal in technical analysis.
How to Use the Triangle Tool
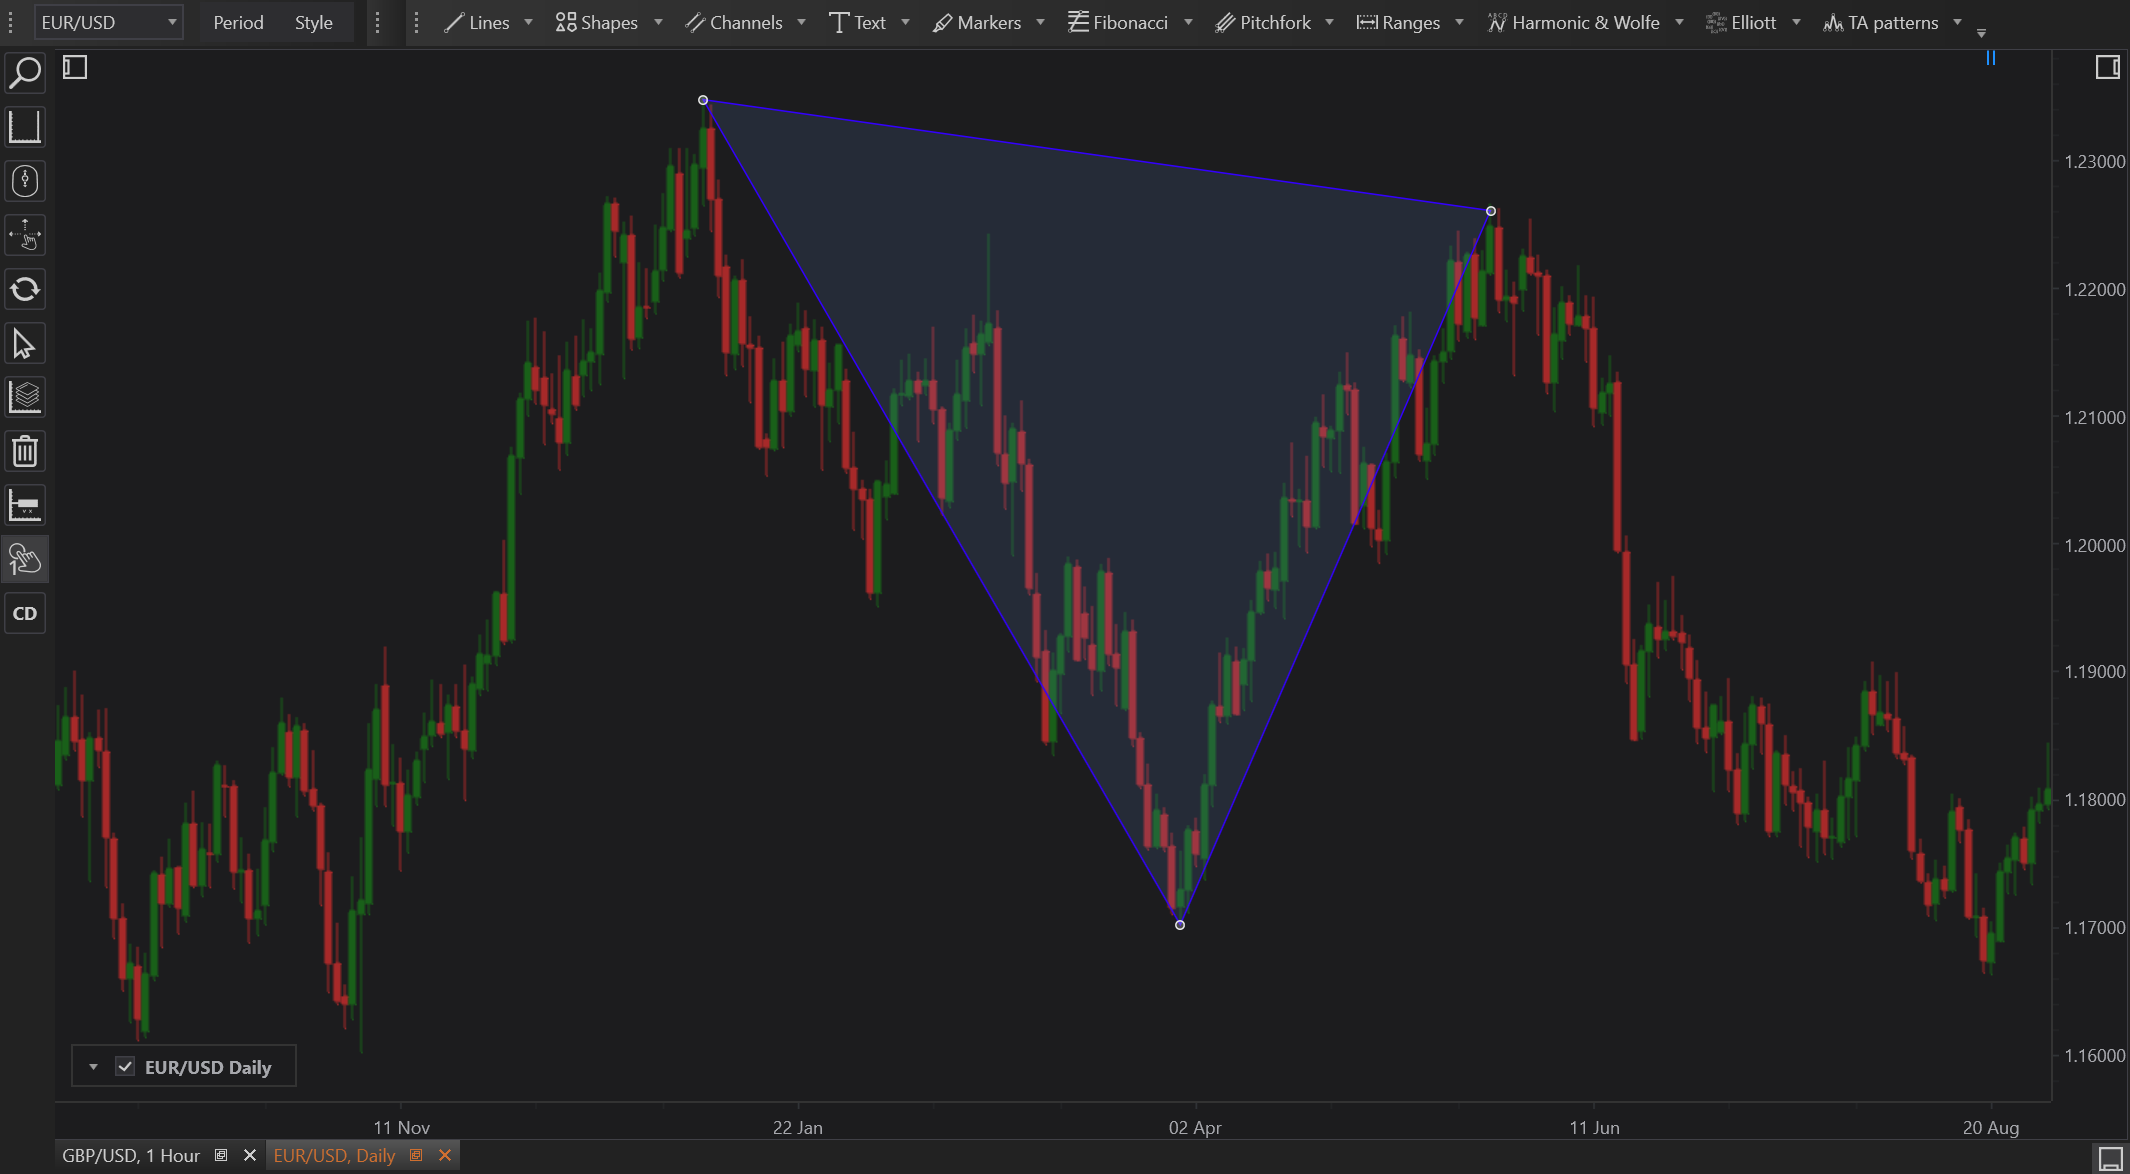
- Access the Tool: Select the Triangle tool from the FinStudio drawing tools toolbar.
- Drawing the Triangle: Click to place the initial point on the chart, and then click again to define the second and third points, forming a triangle.
- Adjusting Shape: The triangle can be resized or reshaped by dragging its points or edges, allowing for precise alignment with chart patterns.
- Customizing Properties: Customize the triangle's appearance through the Properties panel, adjusting line color, thickness, and style, as well as adding a fill color if needed for better visibility.
Practical Examples
- Symmetrical Triangles: Useful in identifying areas where the price action is compressing, leading to a potential breakout. Symmetrical triangles can indicate continuation or reversal based on previous trends.
- Ascending and Descending Triangles: Mark ascending triangles during uptrends and descending triangles during downtrends to signal likely continuations or reversals based on the direction of the incoming trend.
Advantages
- Enhanced Pattern Recognition: Facilitates the identification of common chart patterns that are critical for technical analysis, such as triangles which are often associated with strong future price movements.
- Strategic Trade Setup: Helps in setting up strategic entries and exits based on the boundaries and breakout points of the triangle.
Limitations
- Subjective Interpretation: The placement and interpretation of triangles can be highly subjective and may vary between analysts, potentially leading to different trading conclusions.
- Dependence on Confirmation: Triangles often require confirmation through additional indicators or volume analysis to validate the signal, which might delay trading decisions.
Conclusion
The Triangle tool in FinStudio serves as a fundamental resource for technical analysts focusing on pattern trading. By providing a method to visually track and analyze converging trend lines, it plays a crucial role in forecasting market movements. Its utility in enhancing visibility of critical patterns makes it an indispensable tool, despite the need for careful interpretation and confirmation to maximize its effectiveness.