Overview of the Flag Pattern Drawing Tool
The Flag pattern is a key tool in FinStudio used to identify and capitalize on continuation setups within the markets. Recognized for its short-term consolidation following a sharp price movement, the Flag pattern signals a potential continuation of the prior trend. This pattern is highly valued by traders for its reliability and clear trading signals.
Construction and Use
Select the Tool: Traders can find the Flag pattern tool in the drawing tools menu of FinStudio. It is applied directly on the chart where the pattern seems to be forming after a strong price movement.
Initial Placement:
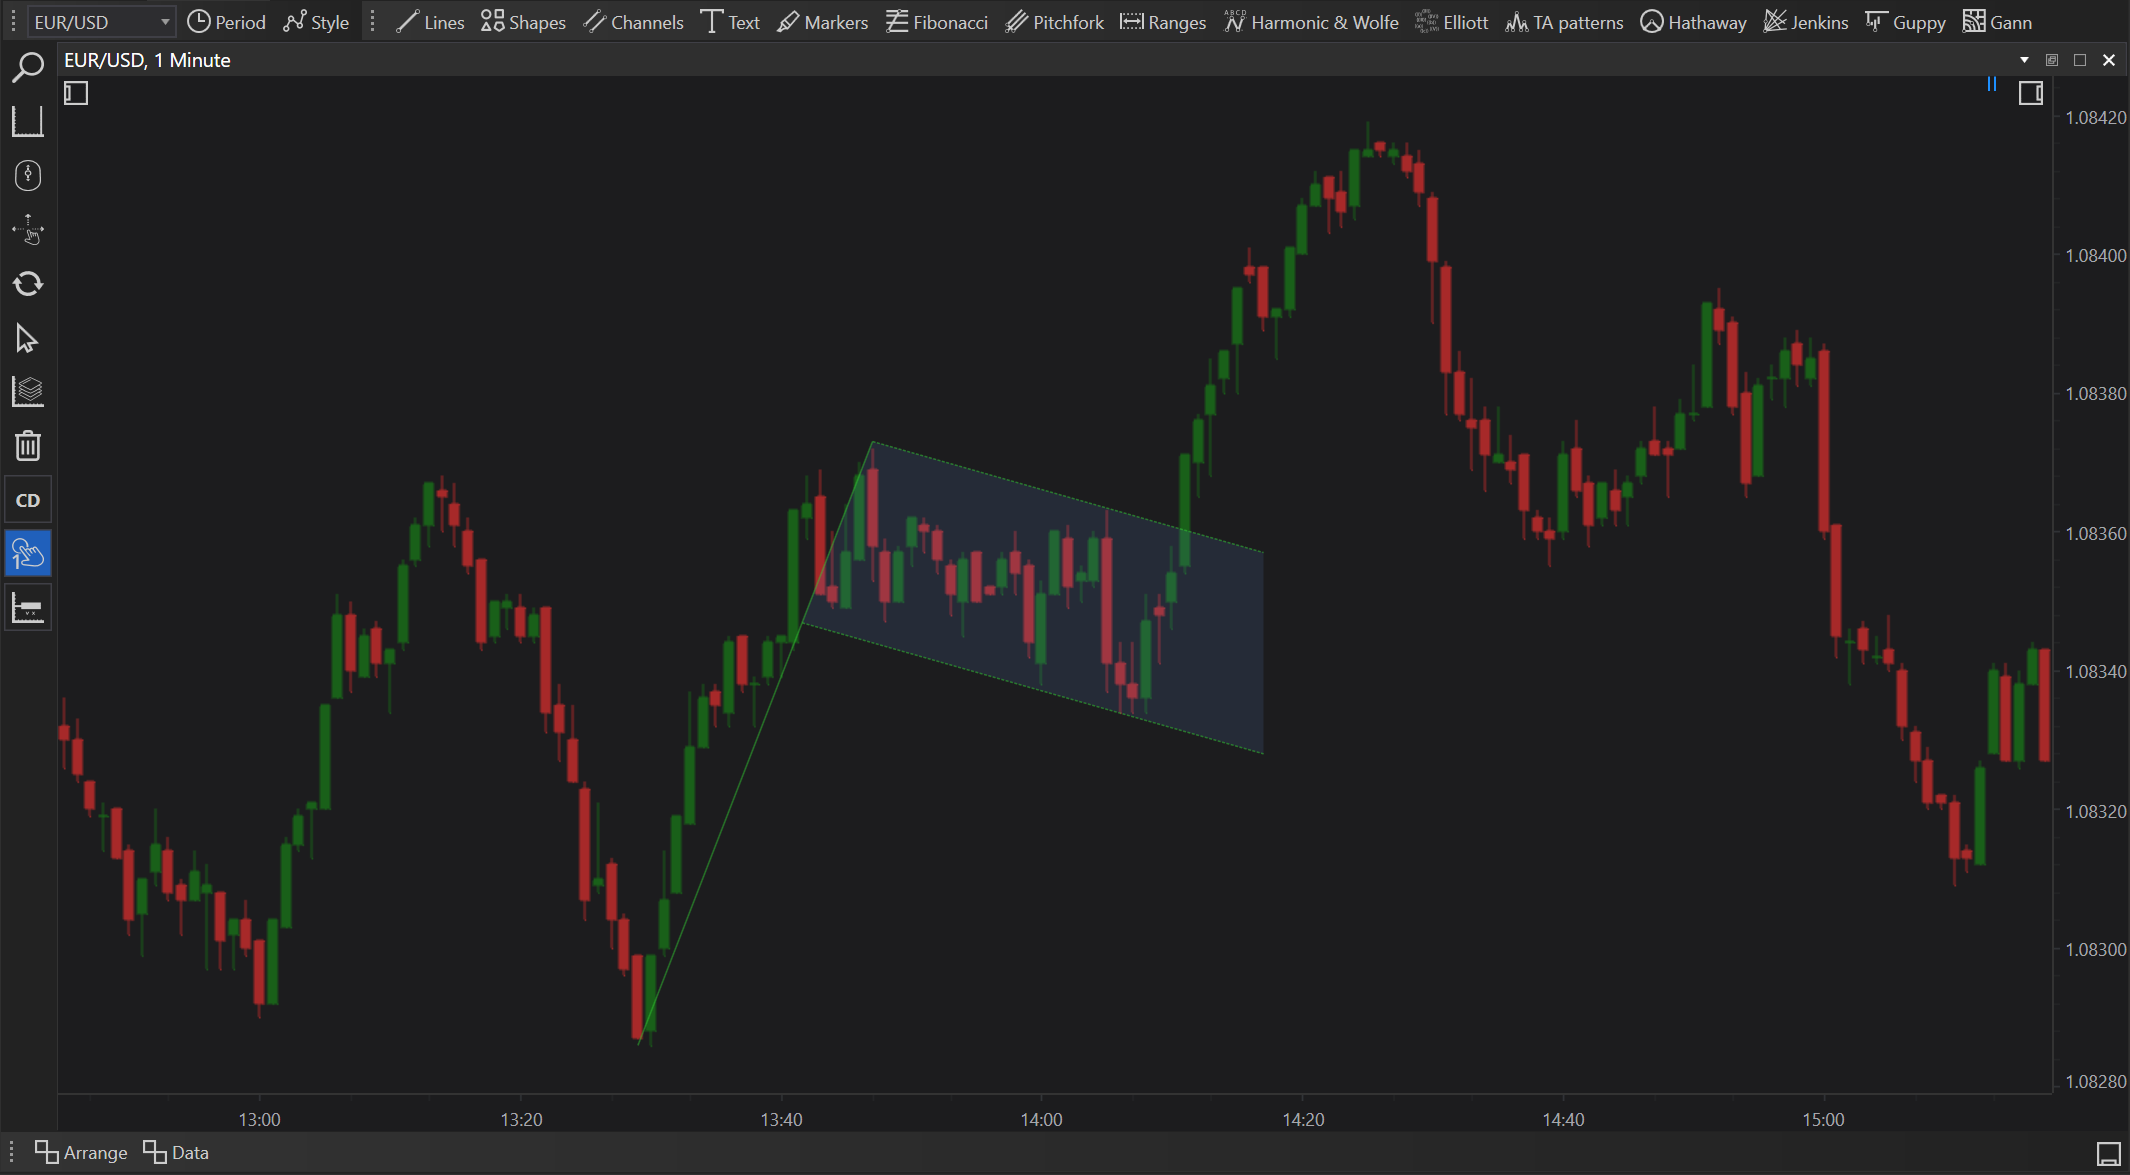
- Flagpole: The initial sharp movement that forms the flagpole can be upward or downward and is essential for the pattern’s recognition.
- Flag: This is the small rectangle or parallelogram that forms after the flagpole, representing a period of consolidation. It typically slopes against the direction of the flagpole.
Drawing the Pattern: Once the flagpole and the flag are identified, the tool outlines these elements, highlighting the consolidation area and suggesting potential breakout or breakdown points.
Features
- Visualization: Clearly delineates the flagpole and the flag, making it visually straightforward for traders to recognize and interpret the pattern.
- Flexibility: Effective across various asset classes and time frames, suitable for day traders and swing traders alike.
- Customization: Offers options to customize line colors and thicknesses to ensure the pattern stands out against the underlying price chart.
Practical Applications
Continuation Trading:
- Use: Traders look for a breakout from the flag in the direction of the initial flagpole as a signal to enter a trade, anticipating the continuation of the prior trend.
- Benefit: Provides a high-probability trading opportunity with a clear risk-reward setup, as the continuation often results in swift price movements.
Risk Management:
- Use: Setting stop-loss orders just outside the flag area, opposite to the breakout direction, to protect against potential false breakouts.
- Benefit: Limits potential losses by ensuring trades are exited quickly if the expected continuation fails to materialize.
Volume Analysis:
- Use: Monitoring volume as the flag forms and during the breakout can confirm the pattern’s strength. Typically, volume diminishes during the formation of the flag and increases significantly during the breakout.
- Benefit: Enhances the reliability of the breakout signal, providing an additional layer of confirmation for the trade.
Benefits
- Enhanced Predictive Accuracy: The Flag pattern is renowned for its effectiveness in predicting short-term price continuations, helping traders to make more informed decisions.
- Strategic Trade Optimization: Allows for precise entry and exit strategies based on the continuation of momentum, optimizing the profitability of trades.
- Increased Trading Efficiency: By offering a clear setup and quick resolution, the Flag pattern enables efficient trading, minimizing the capital exposure time and reducing the opportunity cost.
Conclusion
The Flag pattern drawing tool in FinStudio is an essential resource for traders who specialize in capturing quick movements in volatile markets. By accurately identifying and leveraging these continuation patterns, traders can significantly enhance their trading performance, taking advantage of the natural ebb and flow within trending markets. This tool not only simplifies the identification of continuation patterns but also integrates seamlessly into broader trading strategies, helping traders achieve consistent and reliable results.