Overview of the V Top/Bottom Pattern Drawing Tool
The V Top and V Bottom patterns are distinct and powerful chart formations used in technical analysis to signal sharp reversals. In FinStudio, the V Top/Bottom drawing tool helps traders quickly identify these patterns, which are characterized by a rapid price movement in one direction followed by an equally swift reversal.
Construction and Use
Select the Tool: Traders can access the V Top/Bottom pattern tool from the drawing tools menu in FinStudio, ideal for charts that show extreme volatility or quick price changes.
Initial Placement:
- V Top: This pattern appears when the price ascends sharply to a peak and then declines rapidly, forming a V-shaped peak that signifies a bearish reversal.
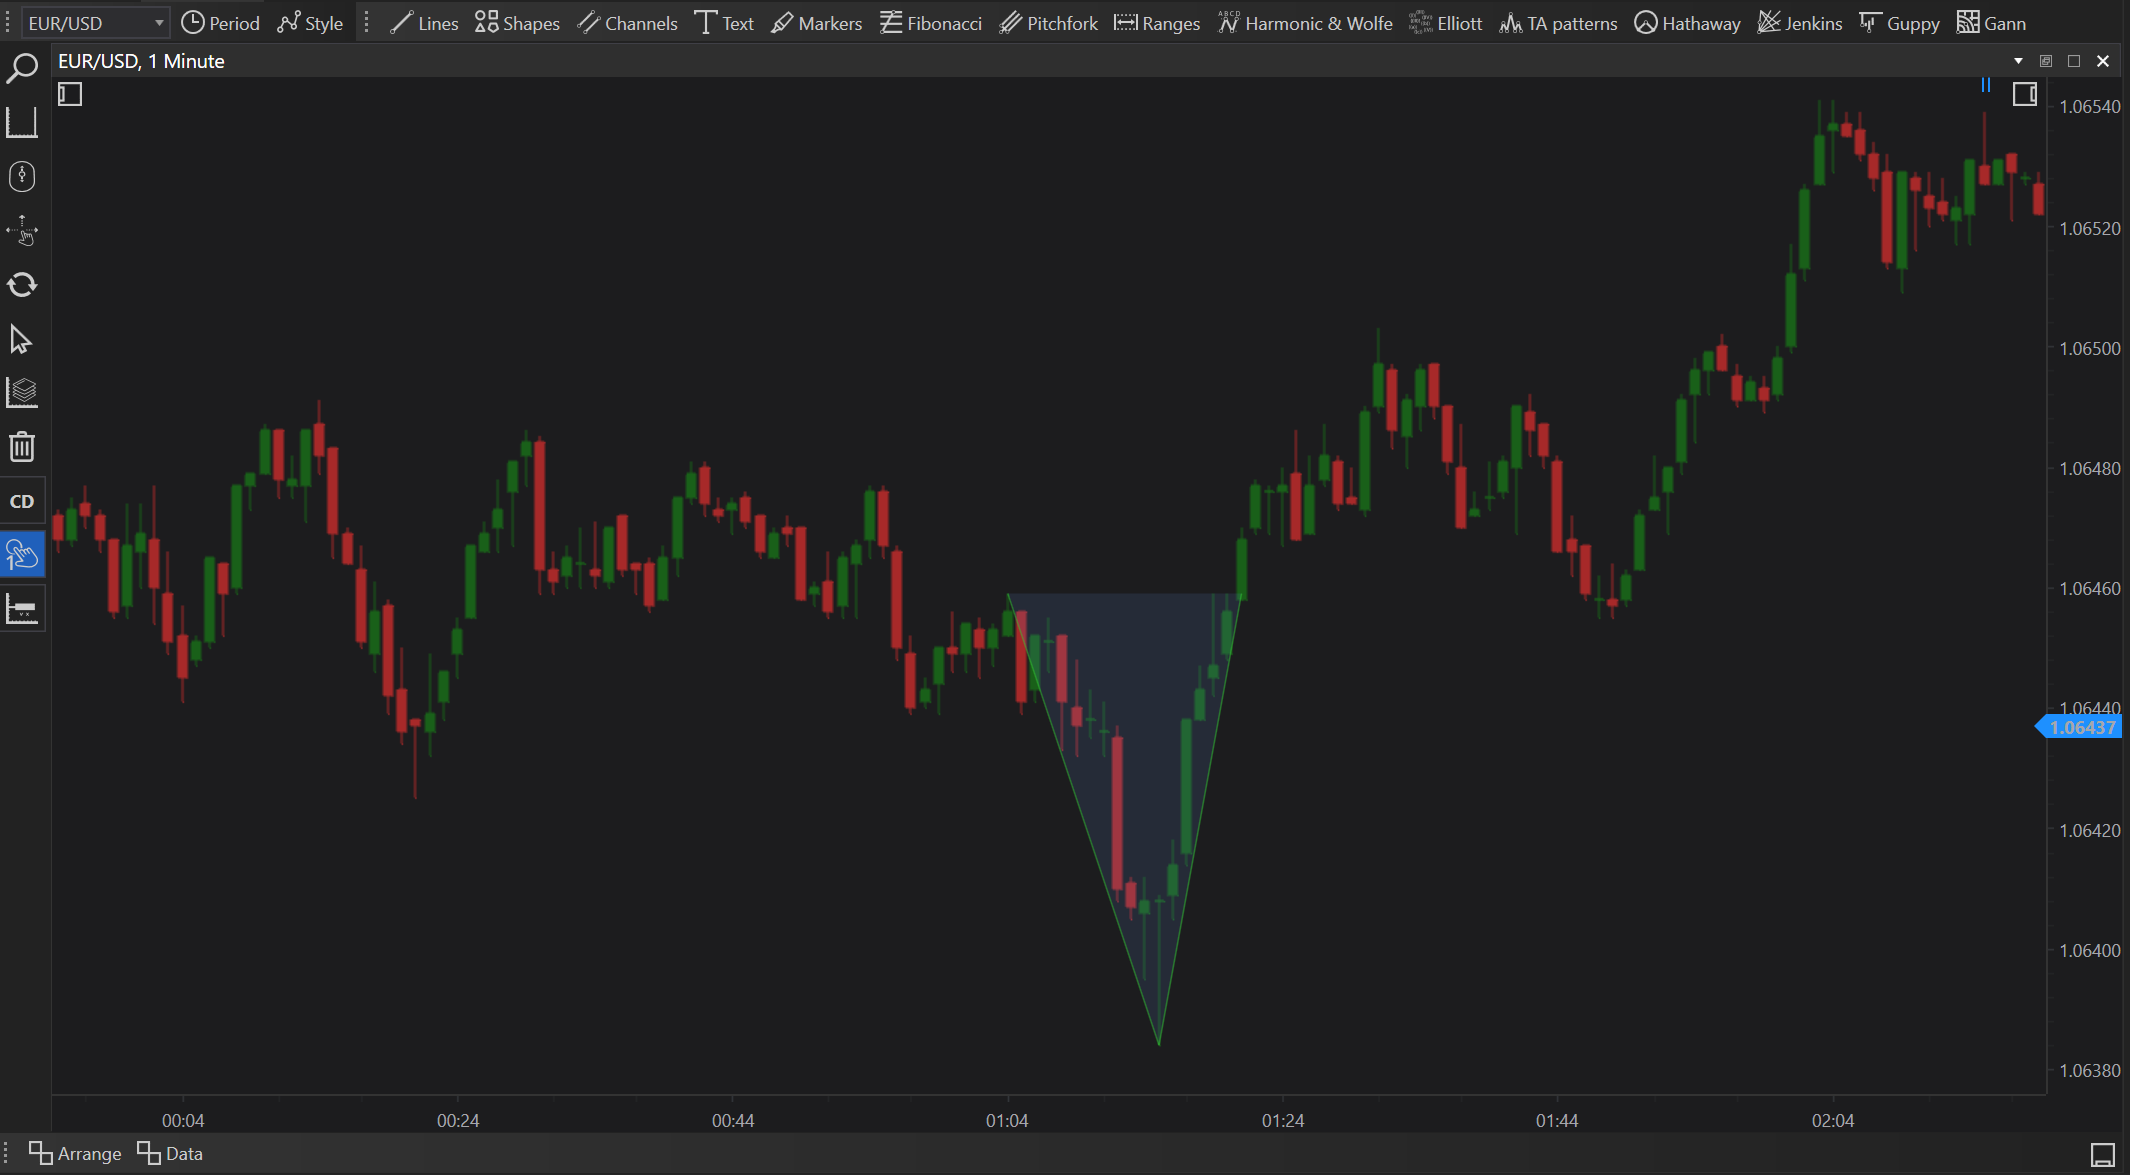
- V Bottom: Conversely, this pattern is observed when the price descends sharply to a trough and then ascends rapidly, forming a V-shaped trough that signifies a bullish reversal.
Drawing the Pattern: The tool outlines the sharp ascent and descent, clearly marking the point of reversal which is crucial for timely trading decisions.
Features
- Visualization: Clearly delineates the dramatic rise and fall of the price, making it easy for traders to recognize and respond to the pattern.
- Flexibility: Effective across various asset classes and suitable for different trading styles, especially in markets known for rapid price changes.
- Customization: Allows for customization of line colors and styles, enhancing visibility and differentiation from other chart elements.
Practical Applications
Reversal Trading:
- Use: Traders utilize the V Top/Bottom patterns to capture swift reversals, typically entering trades as the reversal confirms past the initial pivot point of the pattern.
- Benefit: Provides opportunities to capitalize on quick market shifts, potentially securing profits from volatile movements.
Risk Management:
- Use: Due to the aggressive nature of the V Top/Bottom reversals, setting tight stop-loss orders just past the reversal point (above for V Tops, below for V Bottoms) is crucial to protect against the possibility of a false reversal signal.
- Benefit: Minimizes potential losses by containing risks associated with rapid market movements.
Volume Analysis:
- Use: Volume should spike significantly during the formation of the V pattern, as the swift price change usually attracts a large number of participants.
- Benefit: Confirming the pattern with volume increases the reliability of the trade, providing an extra layer of validation for the pattern.
Benefits
- High Impact Trading: The sharp and clear nature of V Top/Bottom patterns allows for high-impact trading opportunities with significant potential returns.
- Increased Predictive Accuracy: These patterns provide clear signals for sudden market reversals, aiding traders in making precise and informed decisions.
- Enhanced Trading Confidence: The distinctiveness of the V Top/Bottom patterns gives traders confidence, reducing hesitation in execution during volatile market conditions.
Conclusion
The V Top/Bottom drawing tool in FinStudio is an essential resource for traders looking to exploit rapid market reversals. By accurately identifying these patterns, traders can enhance their ability to make strategic decisions, manage risks effectively, and achieve substantial gains in markets characterized by sharp price movements. Whether for quick scalping or strategic positioning in volatile environments, the V Top/Bottom tool offers valuable insights, making it a vital component of a trader’s toolkit for navigating complex financial landscapes.