Overview
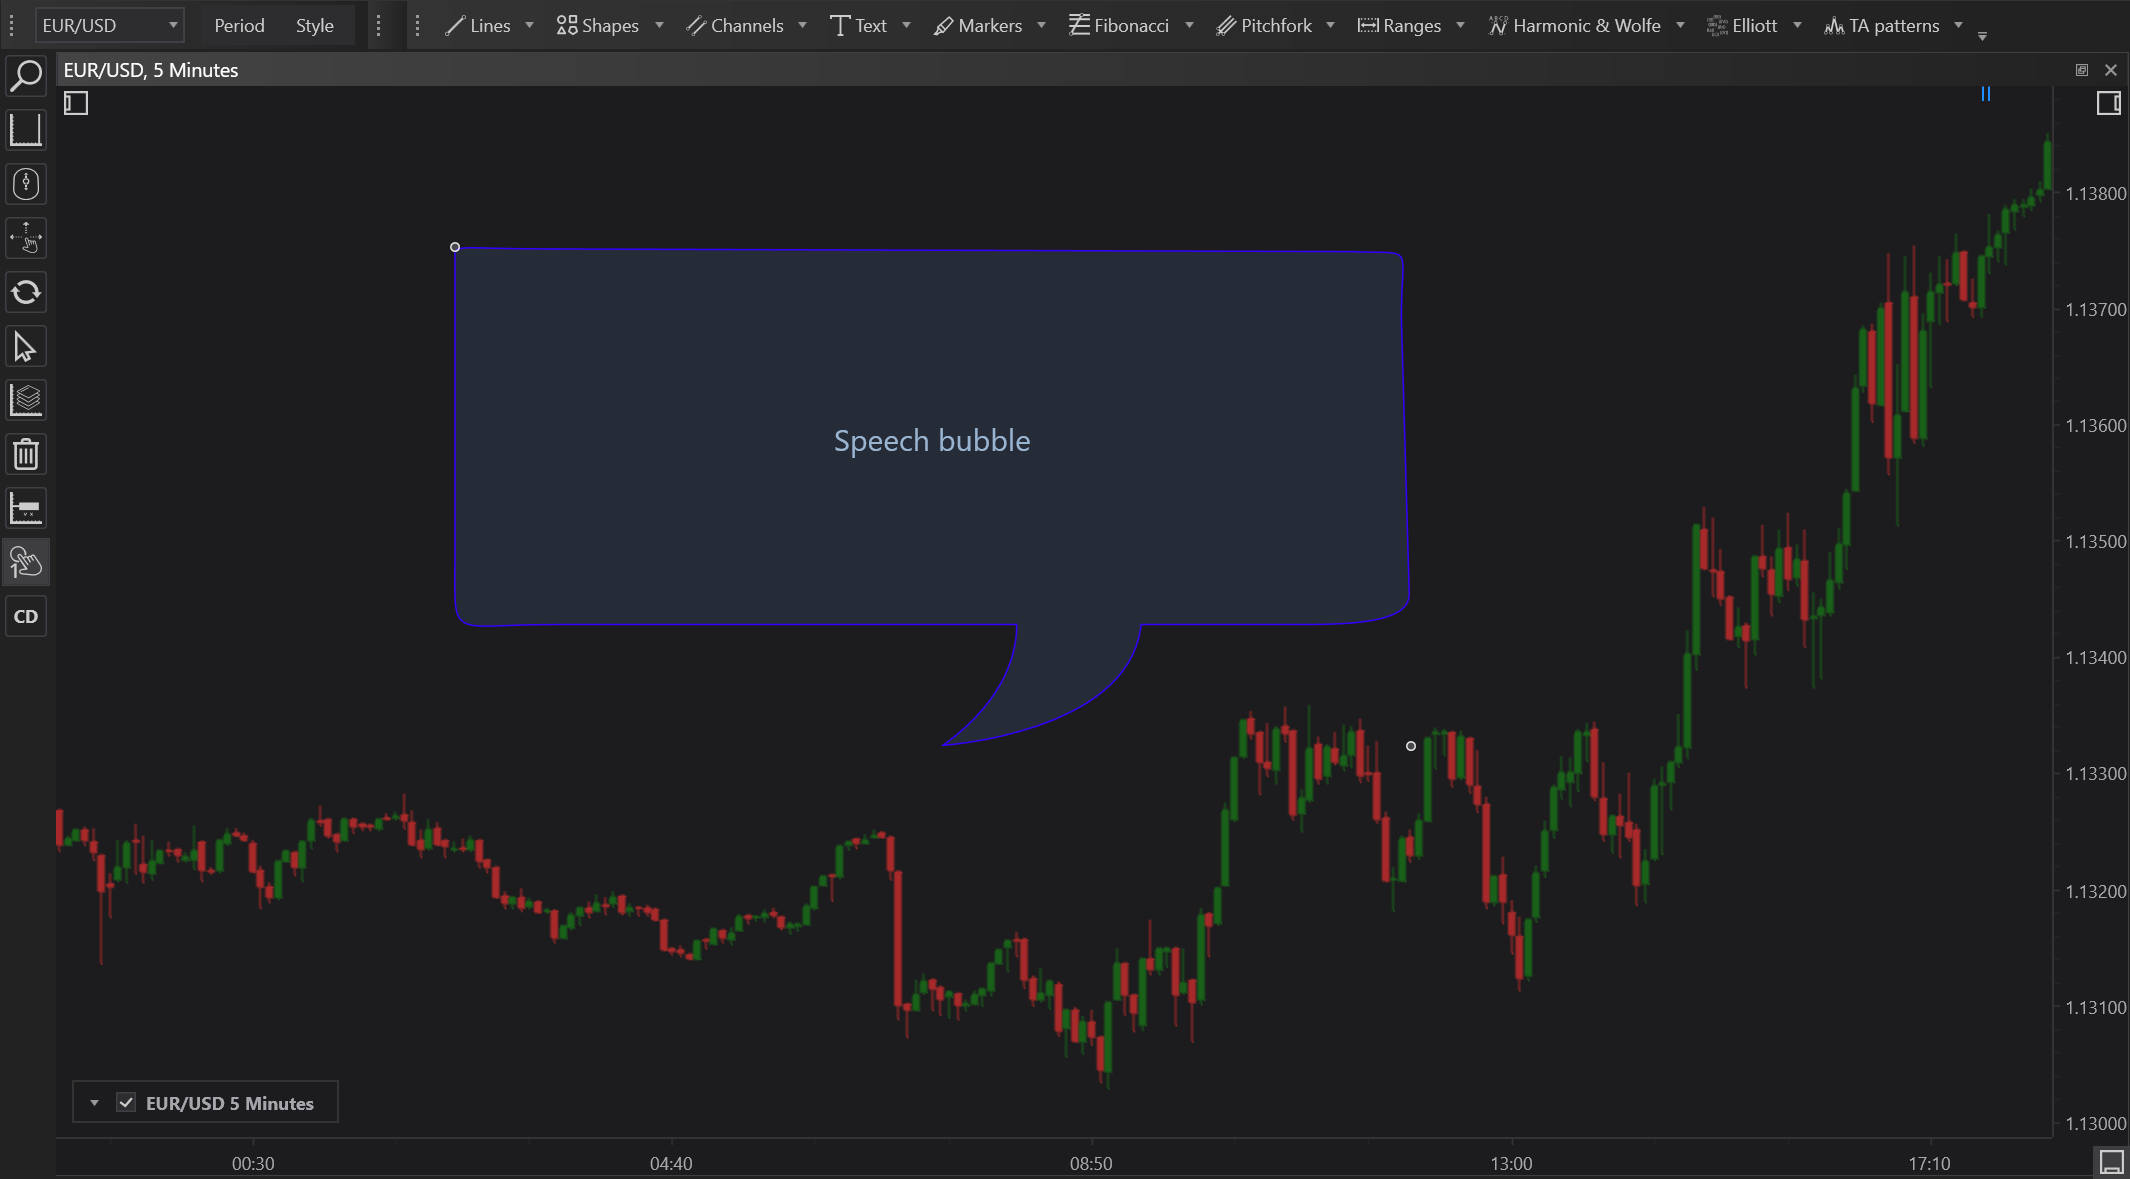
The Rectangle Bubble tool in FinStudio offers traders a practical way to annotate charts with text encapsulated in a rectangular marker. This drawing tool is essential for emphasizing specific areas or notes on financial charts, making it a staple for technical analysis and presentation.
Construction and Use
- Select the Tool: Locate and select the Rectangle Bubble tool from the drawing tools menu.
- Initial Placement: Click on the desired area of the chart to place the rectangle and start typing the necessary text.
- Adjustment: Users can resize or move the rectangle to better align with chart data or other annotations, ensuring optimal placement and visibility.
Features
- Flexible Adjustment: The rectangle bubble can be resized and moved after placement to accommodate changes in analysis or to highlight different chart features effectively.
- Customization Options: Customize the appearance of the rectangle, including its border color, fill color, and opacity, through the Properties section to match the overall theme of the chart.
- Interactive Text Entry: Directly click inside the rectangle to edit the text, with options to adjust the font size, style, and alignment, enhancing the readability and impact of the annotations.
Practical Applications
- Data Highlighting: Ideal for drawing attention to significant price actions, earnings announcements, or other pivotal market events directly on the chart.
- Analytical Notes: Useful for adding explanatory notes or analytical observations next to complex patterns or indicators, aiding in interpretation and decision-making.
- Chart Customization: Enhances chart personalization, allowing traders to create more tailored and informative visual analyses.
Benefits
- Increased Clarity: Helps in making specific observations more visible and distinct, avoiding confusion and aiding quick comprehension.
- Adaptability: Works seamlessly with various types of financial charts, regardless of the asset class or time frame being analyzed.
- Enhanced Communication: Useful for presentations or shared analyses, making it easier to point out and discuss specific chart features or data points.
Conclusion
The Rectangle Bubble tool in FinStudio is an invaluable resource for traders and analysts who frequently work with detailed charts and require a means to annotate and highlight crucial information effectively. By integrating text annotations directly into the visual flow of the chart, it not only aids in personal analysis but also enhances the effectiveness of shared insights and presentations, ensuring that key information is communicated clearly and efficiently.