Overview
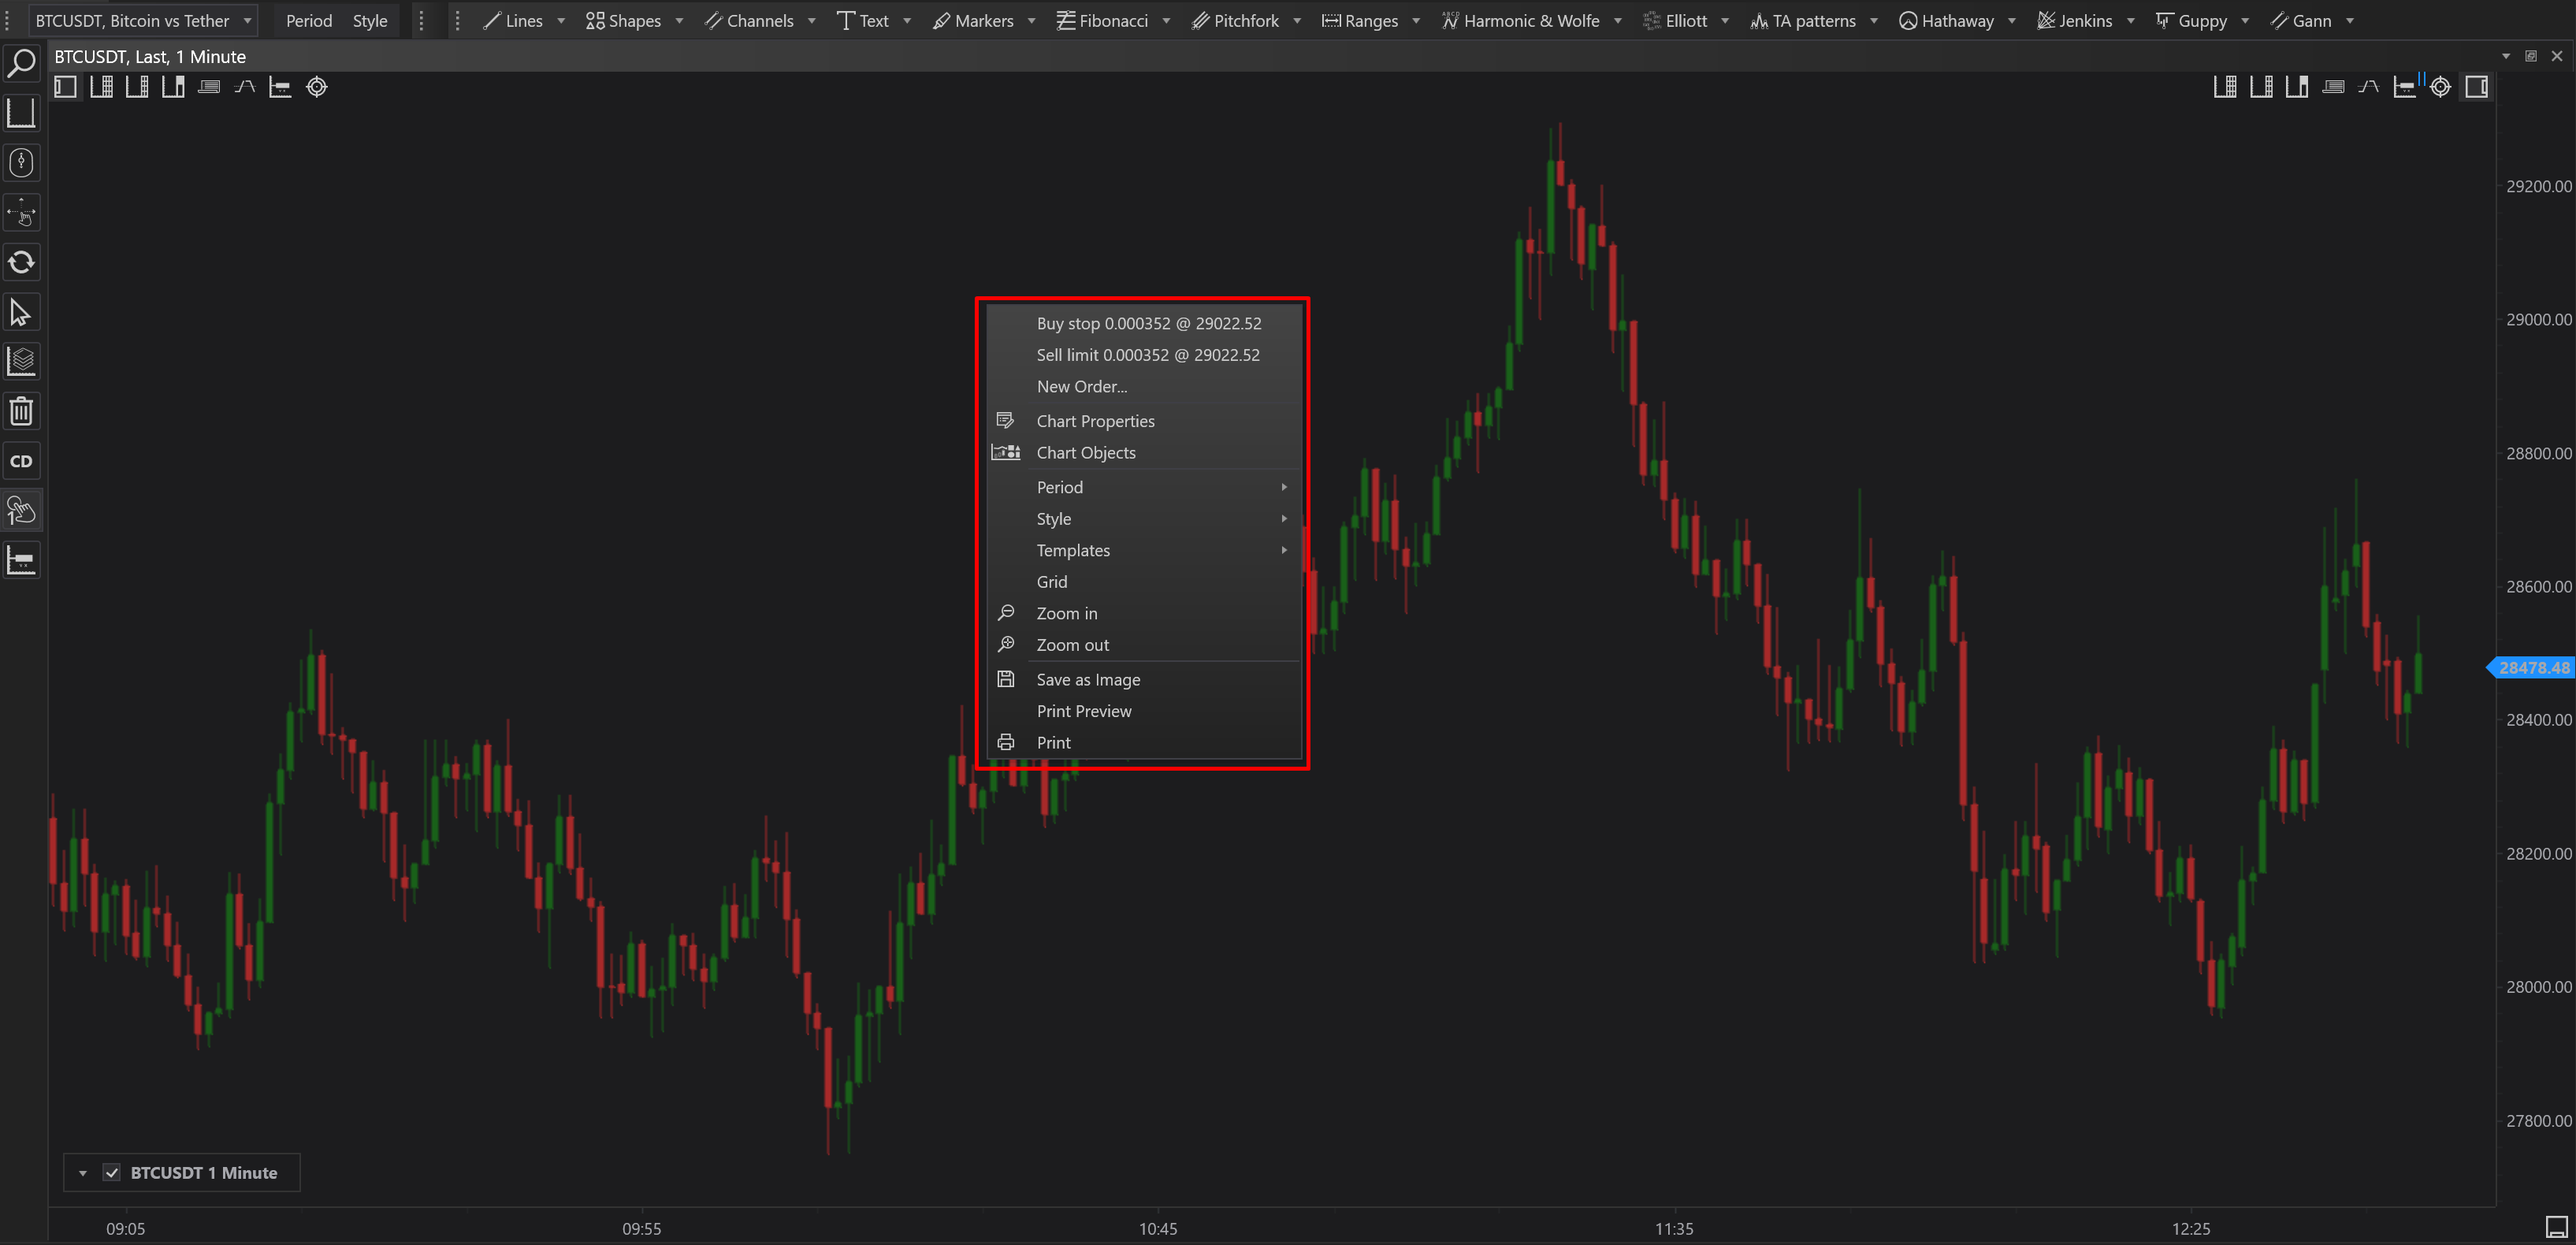
The Chart Right-Click Menu in FinStudio's Charts module is designed to provide users with quick access to frequently used trading and chart management functions. This context-sensitive menu enhances workflow efficiency by placing essential operations right at the user's fingertips, directly on the chart interface.
Menu Items and Functionalities
-
Place Buy/Sell Pending Order
- Functionality
- Users can place a buy or sell pending order directly from the chart. The type of order (Stop or Limit) is automatically determined based on the location of the click relative to the current market price—above for buy, below for sell.
- Usage
- This allows traders to quickly set orders in response to market movements as they analyze the chart, enhancing response times and strategic placement.
- Functionality
-
New Order
- Functionality
- Opens the New Order placement window, where users can manually enter the specifics of a new trade.
- Usage
- Provides a detailed interface for order customization, including setting stop losses, take profit levels, and other trade parameters.
- Functionality
-
Chart Properties
- Functionality
- Accesses a dialog box where users can adjust various chart settings such as color schemes, indicators, and other visual elements.
- Usage
- Allows for the personalization and technical setup of the chart to match user preferences or specific analytical requirements.
- Functionality
-
Chart Objects
- Functionality
- Opens a window where users can view, edit, or delete any graphical objects that have been added to the chart, such as lines, shapes, or annotations.
- Usage
- Helps maintain an organized chart by managing overlays and technical drawing tools, crucial for keeping analyses clear and effective.
- Functionality
-
Period
- Functionality
- Provides a dropdown menu for selecting the chart period, such as 1 minute, 5 minutes, daily, etc.
- Usage
- Allows users to quickly switch between different time frames to view market trends over various intervals, facilitating both short-term and long-term analysis.
- Functionality
-
Style
- Functionality
- Enables users to change the style of the chart, such as from a line chart to a candlestick or bar chart.
- Usage
- Useful for traders who employ different chart analyses, as some styles may reveal market dynamics more clearly than others.
- Functionality
-
Templates
- Functionality
- Allows users to apply predefined or custom templates that alter the chart's entire setup in one click.
- Usage
- Saves time and ensures consistency in chart setup across different trading sessions or analyses.
- Functionality
-
Grid
- Functionality
- Toggles the visibility of the chart grid, which can aid in measuring and aligning graphical objects.
- Usage
- Useful for a cleaner view or when precision in placing technical elements is needed.
- Functionality
-
Zoom In/Out
- Functionality
- Provides quick tools for magnifying or reducing the chart view.
- Usage
- Enhances detail visibility or provides a broader overview of market activity, adaptable to the analysis focus.
- Functionality
-
Save as Image
- Functionality
- Saves the current chart display as an image file.
- Usage
- Ideal for sharing or archiving charts for later review or presentations.
- Functionality
-
Print Preview/Print
- Functionality:
- Allows users to preview the chart before printing and then print the chart directly.
- Usage:
- Useful for creating physical copies of charts for meetings, records, or in-depth analysis away from digital devices.
- Functionality:
Conclusion
The Chart Right-Click Menu in the FinStudio Charts module significantly enhances trading efficiency by streamlining access to essential functions directly from the chart interface. Each menu item is thoughtfully integrated to support quick adjustments, detailed order placement, and personalized chart management, ensuring traders and analysts can adapt swiftly to changing market conditions or analysis needs.