Overview
The Left Chart Menu Toolbar in FinStudio's Charts module is strategically designed for optimal chart interaction and manipulation, providing users with a full array of tools necessary for detailed and efficient data analysis. Positioned on the left side of the chart interface, this toolbar facilitates immediate access to zooming, scrolling, dragging, cursor adjustments, and various other functionalities.

Detailed Functionalities of the Left Chart Menu Toolbar
Zoom Features
The Zoom Features within the FinStudio Charts module are designed to enhance user interaction by providing versatile options for manipulating the visual scale of the chart. These features allow traders to adjust the chart view to better suit their analytical needs, whether they are looking at minute details or broader data trends.

- Zoom In/Out
- The Zoom In and Zoom Out options are fundamental tools that allow users to modify the scale of the chart. Zooming in increases the size of chart elements, making it easier to examine fine details such as small price movements or tightly packed indicators. Conversely, zooming out decreases the size of the elements, providing a broader view of the market trends and allowing users to assess longer time periods or data patterns at a glance.
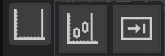
- Zoom to Extents
- The Zoom to Extents feature automatically adjusts the chart's zoom level to include all available data within the visible area of the chart. This ensures that no data point is left outside the immediate visual analysis scope, providing a complete overview of all the plotted data.
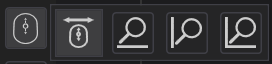
- Toggle Rubber-Band Tool
- The Rubber-Band tool is an interactive feature that allows users to select a specific area of the chart for closer examination. By clicking and dragging a box over the desired section, the chart will zoom directly into the selected area, enabling a detailed focus on the chosen segment.
Chart Navigation
Toggle Scroll to the End Marker/End
The Toggle Scroll features within the FinStudio Charts module are designed to enhance the navigation experience by automatically maintaining focus on the most recent data. These features are especially critical during fast-moving market conditions or when users need to constantly monitor the latest data without manual intervention.
- Toggle Scroll to the End Marker
- This feature automates the scrolling process to ensure that the latest bar, marked by the end marker on the chart, remains visible. When activated, this functionality takes effect if a user scrolls back to view historical data and then ceases interaction. The chart will automatically scroll forward to display the most recent data point marked by the end marker, ensuring that users do not miss any current market activities.
- Toggle Scroll to the End:
- Similar to the 'Toggle Scroll to the End Marker,' this feature ensures automatic scrolling to the very end of the chart, beyond the last data point. It is instrumental during live trading sessions or when new data is continuously being streamed, as it keeps the chart view locked on the most recent market movements.
Mouse Scroll Options
Users can scroll through the chart horizontally or vertically, allowing a thorough examination of the data across different periods or price levels.
- Scroll Chart
- This function enables users to horizontally scroll through the chart. It allows for a smooth navigation experience across different time frames of the data series, making it easier to conduct thorough historical analysis or move quickly to the most recent data.
- Zoom Chart X Axis
- Users can zoom in or out along the horizontal axis of the chart. This function is valuable for adjusting the time scale to display more or fewer data points, thereby helping users focus on specific market events or get a broader overview of market trends.
- Zoom Chart Y Axis
- This zoom function affects the vertical axis, which represents price levels. It allows traders to closely inspect price actions and volatility by enlarging or reducing the scale of price movements displayed on the chart.
- Zoom Chart XY Axis
- This comprehensive zoom control allows simultaneous zooming on both the X and Y axes of the chart, giving a more unified control over the chart's display. This is particularly useful for adjusting the overall view of the chart to match specific analytical needs or preferences.
Dragging Capabilities
The Left-click Drag functions within the FinStudio Charts module provide precise control over chart navigation, enabling users to interact directly with the chart through various dragging actions. These functions are essential for enhancing the interactivity and responsiveness of the chart, allowing users to navigate and examine specific data points or trends with ease.
-
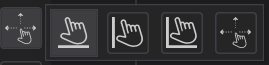
Drag Along X Axis
- This feature allows users to click and drag the chart along the horizontal axis. It is particularly useful for exploring long-term data trends over time without switching to different chart views or adjusting the time scale. This dragging action facilitates a quick and seamless review of historical market movements directly from the main chart interface.
-
Drag Along Y Axis
- Enabling dragging along the vertical axis allows users to move the chart vertically, adjusting the price view. This is beneficial for examining specific price levels or a range of prices in detail, providing a better understanding of market volatility and price dynamics within a selected range.
-
Drag Along XY Axis
- Combining horizontal and vertical dragging, this function allows the chart to be moved in any direction, offering complete freedom in navigating both time and price dimensions simultaneously. This comprehensive control is ideal for users who require a dynamic view of the market, enabling them to adjust both axes in a single action for a holistic analysis.
-
Left-click Dragging Off
- This option disables the dragging feature when the left mouse button is held down and moved. It is useful in situations where users prefer to have a static view of the chart without accidental shifts in the display caused by unintended mouse movements. This setting helps in maintaining a fixed chart perspective, especially during detailed analysis or presentations.
Reset Axis
The Reset Axis functions in the FinStudio Charts module are critical tools designed to quickly revert the chart to its original or default settings regarding axis scaling. These functions are particularly useful after extensive manipulation of the chart's scale for detailed analysis, allowing users to efficiently return to a standardized view.
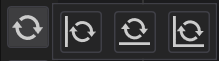
- Reset Price Axis
- This function allows users to reset the scale of the price axis back to its original state. It is essential when the chart's price view has been zoomed in or out to examine specific price levels in detail. By resetting the price axis, users can swiftly return to the default view, which is particularly helpful in re-evaluating the overall market context after focusing on specific segments.
- Reset Time Axis
- The Reset Time Axis function is used to revert the time scale to its initial setup. This is beneficial after users have altered the time scale to look at longer or shorter periods than usual. Resetting the time axis ensures that users can quickly switch back to a standard time perspective, aiding in a broader or more general analysis of market trends.
- Reset Price and Time Axis
- This comprehensive reset function simultaneously reverts both the price and time axes to their original scales. It is extremely useful for users who have significantly modified both dimensions during their analysis and wish to quickly restore the chart to its standard configuration. This function helps maintain consistency in viewing and analyzing data, especially when comparing multiple charts or preparing for new analytical sessions.
Cursor Mode
The Cursor Mode options in the FinStudio Charts module provide users with the flexibility to choose from different cursor styles, enhancing the precision and usability of chart interaction. Each cursor style is designed to cater to specific user preferences and analytical needs, allowing for more effective data examination and navigation within the chart environment.
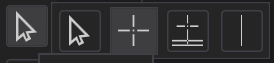
- Arrow Cursor
- The Arrow Cursor is the standard cursor style, appearing as a typical arrow pointer. This cursor is versatile and used for general navigation across the chart interface, selection of menu options, and interaction with chart elements. It is the default mode for most operations where precision in pointing is required but detailed chart interaction is not critical.
- Crosshair Cursor
- The Crosshair Cursor displays as intersecting vertical and horizontal lines that cross at the center, enhancing the ability to pinpoint exact data points on the chart. This cursor is especially useful for traders and analysts who need to assess specific values, price levels, or time points. It allows for precise alignment and measurement of market events and indicators across the chart.
- Extended Crosshair Cursor
- Building on the functionality of the standard crosshair, the Extended Crosshair Cursor extends the crosshair lines beyond the main chart area into the indicator windows. This feature is beneficial for comprehensive analysis that requires alignment checks across multiple data series or indicators. It aids in correlating movements in the main chart with fluctuations in secondary data displayed in indicator panels.
- Vertical Line Cursor
- The Vertical Line Cursor is a specialized cursor that appears as a vertical line moving along the time axis. This cursor style is ideal for examining market changes over time without the distraction of horizontal movement. It helps focus the analysis on how prices have evolved through different trading sessions and is particularly useful for identifying time-specific events or markers.
Chart Overlay
The Chart Overlay functionalities within the FinStudio Charts module enhance the visualization and accessibility of key chart information, making it easier for users to interpret complex data sets. These features are designed to provide additional context and navigational aids directly on the chart, assisting in more efficient and thorough analysis.
-
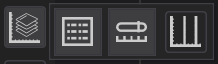
Show Legend
- The Legend function displays a concise, readable summary of all active chart series, such as indicators or plotted data types. This is crucial for users who work with multiple data series simultaneously and need to quickly identify each series without confusion. The legend includes color coding or symbols associated with each data series, offering a straightforward reference that enhances understanding and speeds up analysis.
-
Chart Overview Panel
- The Chart Overview Panel is particularly useful in scenarios where vast amounts of historical data are involved. Navigating such extensive data using only the scroll wheel or keyboard arrows can be cumbersome and inefficient. This panel provides a condensed view of the entire chart, allowing users to quickly and easily jump to any desired time period without the need to scroll through every intermediate point. This is enabled by the integration of the rubber band-tool, which facilitates rapid navigation and selection within the chart, significantly enhancing user interaction with large data sets.
-
Show Period Delimiters
- Period Delimiters are vertical lines that segment the chart into predefined time intervals, such as minutes, hours, days, or months, depending on the overall chart setup and the user’s preferences. These delimiters are immensely helpful for visual segmentation of data, allowing analysts to better understand the temporal distribution of market events and patterns. Users can customize the appearance and frequency of these delimiters via the chart's properties, tailoring the visual output to meet specific analytical needs.
Annotation Management
The annotation management features within the FinStudio Charts module provide essential tools for users to modify and manage annotations on their charts. Annotations are crucial for marking specific data points, noting observations, or highlighting trends directly on the chart. These functions ensure that users can maintain an organized and relevant analytical workspace by easily removing outdated or unnecessary annotations.
-
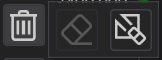
Delete:
- This function is designed to remove selected annotations from the chart. When an annotation, such as a line, text, or shape, is no longer needed or requires replacement, the user can select the specific annotation and use this option to remove it. This is particularly useful in maintaining clarity and avoiding clutter as the analysis progresses and conditions change.
-
Clear All Annotations:
- The Clear All function allows users to remove all annotations from the chart at once. This feature is extremely helpful when preparing the chart for a new analysis session or when the chart becomes overly cluttered with numerous annotations that are no longer relevant. By clearing all annotations, users can start fresh, ensuring that only pertinent information is displayed, aiding in clearer analysis and decision-making.
Special Functions
The FinStudio Charts module features a variety of functionalities designed to simplify and enhance user interaction with the chart that can be activated by button. These buttons offer straightforward, single-function operations that provide quick access to specific trading tools and chart modification features. Each button is crafted to improve efficiency in the trading workflow, catering to both analytical and operational needs directly from the chart interface.
-
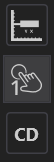
Axis Label Trading
- The Axis Label Trading button toggles the activation of the axis label trading panel. When activated, this feature allows traders to execute trades directly from the axis labels, integrating trading functionality seamlessly with the chart viewing experience. This can be particularly useful for traders who work with price action and want to make quick trade decisions based on specific price levels displayed on the chart’s axes. A second press of the button deactivates the panel, returning the user to normal chart interaction modes.
-
Zones & DOM (Depth of Market) One-Click Trading
- The Zones & DOM One-Click Trading button enables traders to execute trades with a single click, based on predefined zones or directly from the DOM view. This functionality is designed for high-speed trading environments where time and speed are crucial. Activating this feature streamlines the trading process, allowing for rapid response to market movements without navigating away from the chart or entering multiple trade commands.
-
Continuous Drawing
- The Continuous Drawing button is an essential tool for technical analysts who frequently use charting tools such as trendlines, channels, or other repetitive drawing instruments. When engaged, this button allows the trader to continuously draw the same tool multiple times without the need to reselect the tool after each use. This is particularly handy when conducting complex technical analysis that requires multiple instances of the same graphical tool. It enhances efficiency by reducing the clicks and interactions needed to apply technical analysis tools repeatedly.
Conclusion
The Left Chart Menu Toolbar in FinStudio's Charts module is an indispensable tool for traders and analysts, packed with advanced functionalities for comprehensive chart control and data analysis. This detailed documentation serves to empower users to fully utilize these tools, optimizing their analytical capabilities and ensuring a more effective trading environment.